Figures & data
Figure 1. Label-free quantitative proteomic analyses and western blotting validation of differential proteins. (A) 2D feature maps of LC-MS/MS data from one analysis between SKOV3-TR30 and SKOV3. LC-MS/MS data were represented as a 2-dimensional image, where the horizontal axis was a retention time, the vertical axis was a mass-to-charge ratio and the gray color level indicated the intensity value. (B) Classification of differential proteins according to the GO analyses. A total of 260 out of 356 dysregulated proteins were categorized into metabolic process, regulation of biological process, transport, multicellular organismal development, cell differentiation, transcription, etc. (C) Validation of the differential expression of 6 selected proteins. Protein levels of TXNDC17, PGAM1, ALDOC, FLNA, UTP23, and CNN3 were determined by western blotting in paclitaxel-resistant SKOV3-TR30 and A2780-TR cells compared with parental SKOV3 and A2780 cells, respectively. GAPDH was analyzed as the loading control.
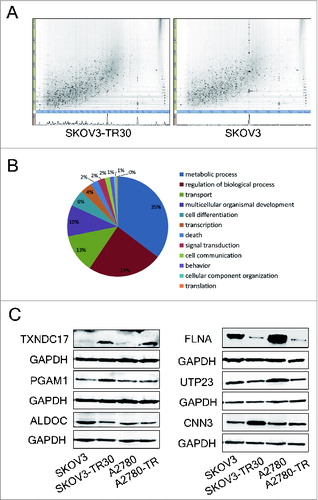
Table 1. The association of TXNDC17 expression with clinicopathological parameters and BECN1 expression
Table 2. The relationship between BECN1 expression and clinicopathological parameters
Figure 2. Immunohistochemistry of TXNDC17 and BECN1 expression and patient prognosis and survival analysis. (A) Two serial sections from the same paraffin-embedded block from 157 ovarian cancer patients were used for detection using anti-TXNDC17 and anti-BECN1 antibodies, respectively. Representative TXNDC17 and BECN1 staining from a chemoresistant (4+) and a chemosensitive (1+) tissue is shown at 200× and 400× magnifications. (B) Kaplan–Meier survival curves for PFS and OS in ovarian cancer patients with different TXNDC17 and BECN1 protein levels. HR and 95% CI were measured by univariate Cox regression analysis. (C) Combined analysis of TXNDC17 and BECN1 expression in the prognostic value of patients with ovarian cancer by Kaplan–Meier survival curves. *, TXNDC17high/BECN1high VS TXNDC17low/BECN1low.
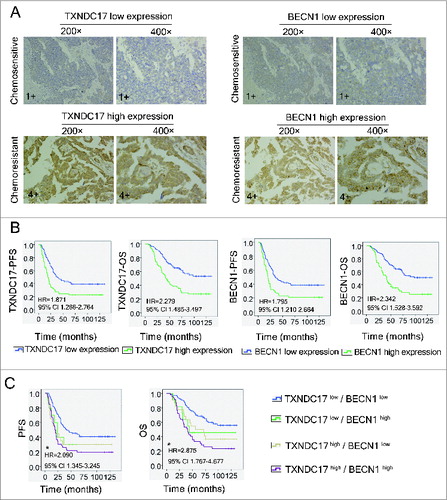
Figure 3. Paclitaxel exposure upregulates the expression of TXNDC17 and autophagic proteins. A2780 (A), 3AO (B), and SKOV3 (C) cells were plated in 6-well plates overnight and reached 60% to 70% confluence when paclitaxel was added in the complete medium at final concentration 2, 5, and 10 nM. Total cell lysates were extracted after 3, 6, 12, 24, and 48 h of paclitaxel treatment. Protein levels of LC3B, ATG5, BECN1, and TXNDC17 were detected by western blotting. Cells without paclitaxel treatment were assigned as blank control (Blank). GAPDH was analyzed as the loading control. Data are representative of 3 independent experiments.
Figure 4 (See previous page). Paclitaxel increases autophagosome formation and autophagic flux. (A) A2780, 3AO, and SKOV3 cells were treated with 10 nM paclitaxel with and without 10 nM BafA1 for 24 h and the protein levels of LC3B and SQSTM1 were assessed by western blotting. Cells without paclitaxel treatment with and without 10 nM BafA1 were assigned as controls (Blank and Blank+BafA1). GAPDH was assigned as the loading control. Data are representative of 3 independent experiments. (B) A2780, 3AO and SKOV3 cells were transfected with the GFP-LC3-plasmid overnight and transferred on the coverslips. After a 24-h exposure to 10 nM paclitaxel with and without 10 nM BafA1, representative images of GFP-LC3-II-positive puncta were photographed with a confocal fluorescence microscope. Cells without paclitaxel treatment with and without 10 nM BafA1 were assigned as controls (Blank and Blank+BafA1). DAPI: staining for the nuclei. (C) The number of GFP-LC3-II-positive puncta in 50 GFP-positive cells for each group was counted using the Metamoph offline 7.7.8.0 software package and the GFP-LC3-II-positive puncta per cell were calculated. Three independent experiments were performed and the values were expressed as the mean ± SD, * P < 0.05, ** P < 0.01. (D) Autophagosome and autolysosome vesicles of A2780, 3AO and SKOV3 cells treated with 10 nM paclitaxel for 24 h were visualized by transmission electron microscopy. The typical images of autophagosomes and autolysosomes (red arrows) are shown at high magnification.
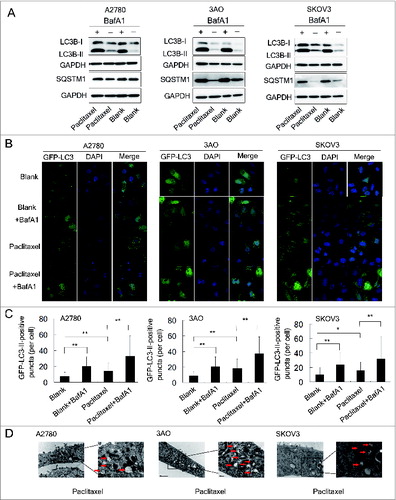
Figure 5. TXNDC17 modulates paclitaxel sensitivity. (A and B) A2780 and 3AO cells were transfected with TXNDC17-specific siRNA (line +) or scrambled siRNA (line NC); (C and D) A2780 and 3AO cells were transfected with a pcDNA3.1(+)-TXNDC17 (line +) or pcDNA3.1(+) (line Mock) plasmid; (E and F) A2780 and 3AO cells were transfected with BECN1-specific siRNA (line +) or scrambled siRNA (line NC) after transfection with pcDNA3.1(+)-TXNDC17 and selection with G418 (400 μg/mL) for 10 d, then the cells were seeded in 96-well plates and exposed to paclitaxel at various final concentrations for 24 h. Cell viability was measured by CCK-8 kit after 48 h. Data are representative of 3 independent experiments and are expressed as the means ± SD.** P < 0.01, * P < 0.05.
Figure 6. TXNDC17 regulates BECN1 expression and autophagy. (A) A2780 and 3AO cells were transfected with TXNDC17-specific siRNA (line +) or scrambled siRNA (line NC), (B) A2780 and 3AO cells were transfected with a pcDNA3.1(+)-TXNDC17 (line +) or pcDNA3.1(+) (line Mock) plasmid, then TXNDC17 and BECN1 were assessed by western blotting. (C) For TXNDC17 knockdown or (D) TXNDC17 overexpression A2780 and 3AO cells were cultured in complete medium, or starved with HBSS (4 h for A2780, 2 h for 3AO), or treated with 10 nM paclitaxel with and without 10 nM BafA1. Total cell lysates were collected 48 h after transfection. Protein levels of LC3B and SQSTM1 were determined by western blotting. GAPDH was measured as the loading control. Data are representative of 3 independent experiments. (E) A2780 and 3AO cells were transfected with pcDNA3.1(+)-TXNDC17 and selected with G418 (400 μg/mL) for 10 d, then were transfected with BECN1-specific siRNA (line +) or scrambled siRNA (line NC). Protein levels of LC3B, SQSTM1, and BECN1 were detected by western blotting after the cells were treated with starvation and paclitaxel as previously described. GAPDH was measured as the loading control. Data are representative of 3 independent experiments.
Figure 7. Abrogation of BECN1 inhibits autophagy and potentiates paclitaxel cytotoxicity. (A) A2780 and 3AO cells were transfected with BECN1-specific siRNA (line +) or scrambled siRNA (line NC), then were cultured in complete medium, or starved with HBSS (4 h for A2780, 2 h for 3AO), or treated with 10 nM paclitaxel with and without 10 nM BafA1. Whole cell extracts were collected 48 h after siRNA transfection. Protein levels of LC3B and SQSTM1 were determined by western blotting. GAPDH was measured as the loading control. Data were representative of 3 independent experiments. (B) The protein levels of TXNDC17 and BECN1 were detected by western blotting in A2780 and 3AO cells after BECN1 knockdown. (C) A2780 and 3AO cells transfected with BECN1-specific siRNA (line +) or scrambled siRNA (line NC) were seeded in 96-well plates and exposed to paclitaxel at various final concentrations (0, 2, 5, 10, 20, 50 nM; 3 wells for each concentration) for 24 h. Cell viability was measured by CCK-8 kit after 48 h. Data are representative of 3 independent experiments and are expressed as the means ± SD. ** P < 0.01, * P < 0.05.