Figures & data
Figure 1. ATM regulated TPT-induced PTEN nuclear translocation in A549 and HeLa cells. (A) Representative photomicrographs showed endogenous PTEN translocation (100×). A549 and HeLa cells were treated with 3 μg/mL TPT and/or 10 μM KU55933 for 24 h. (B) 3×Flag-PTEN-WT plasmids were transfected into the HeLa cells, and the transfection efficiency was confirmed by western blot analysis. (C) Representative photomicrograph images showed exogenous PTEN translocation (100×). HeLa cells were transiently transfected with 3×Flag-PTEN-WT plasmids, and 24 h after transfection, the cells were treated with 3 μg/mL TPT and/or 10 μM KU55933 and/or ATM siRNA for 24 h. (D) Representative photomicrograph images showing exogenous PTEN translocation (100×). HeLa cells were transiently transfected with 3×Flag-PTEN-WT or 3×Flag-PTENS113A plasmids, and 24 h after transfection, the cells were treated with 6 μg/mL CDDP. (E) Western blot analysis result of exogenous PTEN nuclear translocation in A549 and HeLa cells when treated with 3 μg/mL TPT and/or 10 μM KU55933 for 24 h. (F) Western blotting result of exogenous PTEN nuclear translocation in A549 and HeLa cells when treated with 3 μg/mL TPT and/or ATM siRNA for 24 h.
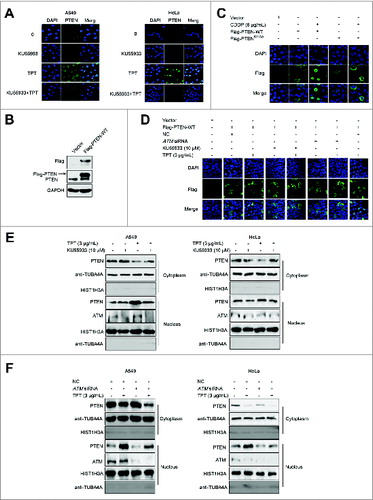
Figure 2. ATM mediated TPT-induced PTEN phosphorylation. (A) Sequence analysis of PTEN was performed by Scansite software. The sequence of PTEN was retrieved from GenBank. (B) A549 cells were treated with 3 μg/mL TPT, λ-phosphatase, and PPase inhibitors as indicated. Tagged proteins were analyzed by immunoblotting. (C) HeLa cells were transiently transfected with the 3×Flag-PTEN-WT plasmid,then treated with various concentrations of TPT or CDDP. (D) A549 and HeLa cells were transiently transfected with 3×Flag-PTEN-WT plasmids, and 24 h after transfection, the cells were treated with 3 μg/mL TPT; then, immunoprecipitation was conducted with an antibody against Flag. The precipitates were subjected to SDS-PAGE and probed with antibody against phospho-PTENS113. (E) A549 cells were treated with 3 μg/mL TPT for 24 h in the absence or presence of ATM siRNA- or KU55933, and then immunoblotting analysis was performed. (F) In vitro phosphorylation assays with active ATM kinase and purified PTEN recombinant proteins. Reaction products were subjected to SDS-PAGE and probed with antibody against phospho-PTENS113.
Figure 3. TPT-induced PTEN nuclear translocation was dependent on PTEN (S113) phosphorylation in A549 and HeLa cells. A549 cells and/or HeLa cells were transiently transfected with the 3×Flag-PTEN-WT or 3×Flag-PTENS113A plasmid, and 24 h after transfection, the cells were treated with or without 3 μg/mL TPT. (A) Representative photomicrograph images showing PTEN translocation (200×). (B) The expression levels of PTEN and p-PTENS113 were analyzed by immunoblotting. (C) Representative photomicrograph images showing PTEN translocation (200×) after treatment of 10 ng/mL of leptomycin B for 24 h.
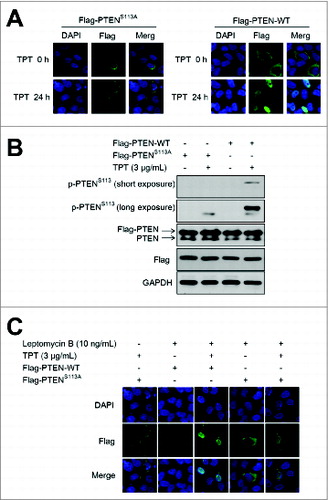
Figure 4. The PTENS113A mutant enhanced TPT-induced DNA damage in A549 and HeLa cells. (A) A549 and HeLa cells were transiently transfected with the 3×Flag-PTEN-WT or 3×Flag-PTENS113A plasmid, and 24 h after transfection, the cells were treated with or without 3 μg/mL TPT. Representative photomicrograph images showed accumulation of γ-H2AFX as an indicator of DNA damage (100×). (B) Bar graphs representing the percentage of γ-H2AFX-positive cells upon treatment with TPT for 24 h (*P < 0.05, **P <0.001, t test, n = 3 , bars represent SEM, Cells containing more than 5 foci were scored as positive). (C) A549 and HeLa cells were transiently transfected with the 3×Flag-PTEN-WT or 3×Flag-PTENS113A plasmid, and 24 h after transfection, the ells were treated with or without 3 μg/mL TPT. The expression levels of γ-H2AFX protein were analyzed by immunoblotting.
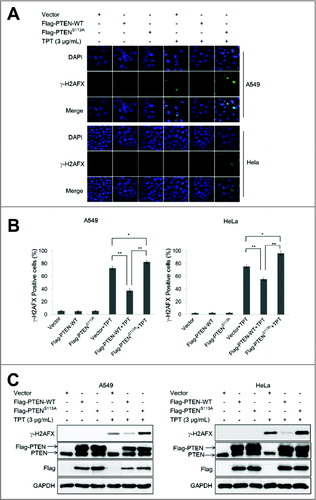
Figure 5. TPT-induced autophagy in A549 and HeLa cells. (A) A549 and HeLa cells were transiently transfected with YFP-LC3 plasmids. Cells were treated with or without 3 μg/mL TPT for 24 h. Green YFP autofluorescence (YFP-LC3) was analyzed by confocal microscopy (100×). (B) A549 and HeLa cells were treated with various concentrations of TPT for 24 h or with 3 μg/mL TPT for the indicated periods. The expression levels of MAP1LC3/LC3 and SQSTM1/p62 protein were analyzed by immunoblotting.
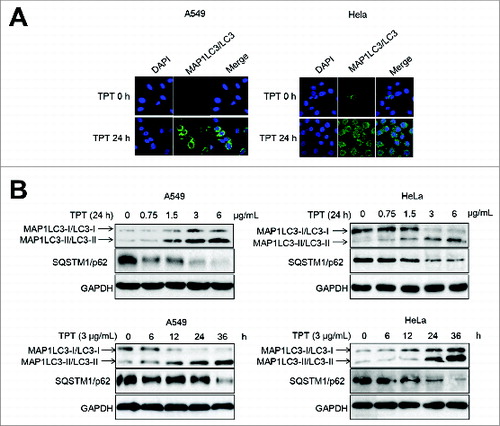
Figure 6. Effect of PTEN expression level on TPT-induced autophagy in A549 and HeLa cells. (A) A549 and HeLa cells were stably transfected with PTEN shRNA plasmids. Cells were treated with or without 3 μg/mL TPT for 24 h. The expression levels of PTEN, MAP1LC3/LC3, and SQSTM1/p62 protein were analyzed by immunoblotting. Bar graphs represent the relative MAP1LC3/LC3-II and SQSTM1/p62 protein levels normalized to that of GAPDH of different groups (*P < 0.05, **P < 0.001, t test, n = 3 ). (B) A549 and HeLa cells were transiently transfected with the 3×Flag-PTEN-WT plasmids. Cells were treated with or without 3μg/mL TPT for 24 h. The expression levels of Flag, PTEN, MAP1LC3/LC3, and SQSTM1/p62 protein were analyzed by immunoblotting. Bar graphs represent the relative MAP1LC3/LC3-II and SQSTM1/p62 protein levels normalized to that of GAPDH of different groups. (*P < 0.05, **P < 0.001, t test, n = 3 ). (C) The effect of PTENS113 phosphorylation on autophagy in A549 and HeLa cells. The expression levels of MAP1LC3/LC3 protein were analyzed by immunoblotting. (D) HeLa cells were transiently transfected with the 3×Flag-PTEN-WT or 3×Flag-PTENS113A plasmid and YFP-LC3 plasmids. Twenty four h after transfection, the cells were treated with or without 3 μg/mL TPT. Green YFP autofluorescence (YFP-LC3) was analyzed by confocal microscopy (100×). Bar graphs represent the percentage of YFP- LC3-positive cells in control or TPT-treated group (*P < 0.05, **P < 0.001, t test, n = 3 , bars represent SEM, Cells containing more than 5 foci were scored as positive). (E) A549 and HeLa cells were treated with or without 3 μg/mL TPT for 24 h, followed by treatment with 100 μM bafilomycin A1 (Baf.A1) as indicated. The expression levels of MAP1LC3/LC3 and SQSTM1/p62 protein were analyzed by immunoblotting.
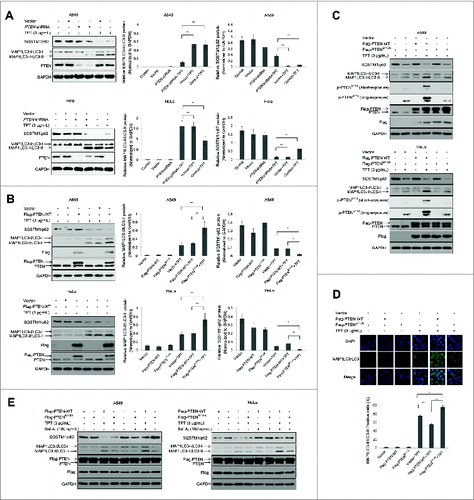
Figure 7. PTEN promoted TPT-induced autophagy via activation of the p-JUN-SESN2-AMPK pathway in A549 and HeLa cells. (A) The cells were treated with or without 3 μg/mL TPT, and the expression levels of JUN, p-JUN, SESN2, AMPK, p-AMPK, RPS6KB, and p-RPS6KB protein were analyzed by immunoblotting. (B) The cells were treated with or without 3 μg/mL TPT and/or JUN siRNA for 24 h, and the expression levels of JUN, p-JUN, SESN2, AMPK, p-AMPK, RPS6KB, p-RPS6KB, and LC3 protein were analyzed by immunoblotting. Bar graphs represent the relative MAP1LC3/LC3-II protein levels normalized to that of GAPDH of different groups. (*P < 0.05, **P < 0.001, t test, n = 3 ). (C) The cells were treated with or without 3 μg/mL TPT and/or AMPK siRNA for 24 h, and the expression levels of p-AMPK, AMPK, RPS6KB, p-RPS6KB, and MAP1LC3/LC3 protein were analyzed by immunoblotting. Bar graphs represent the relative MAP1LC3/LC3-II protein levels normalized to that of GAPDH of different groups. (*P <0.05, **P < 0.001, t test, n = 3 ). (D) The cells were treated with or without 3 μg/mL TPT, and the expression levels of p-GSK3B, GSK3B, p-AKT, and AKT protein were analyzed by immunoblotting.