Figures & data
Figure 1. AU4S can be specifically recognized by recombinant ATG4 proteases. (A) A diagram for the compositions of the AU4S, AG4R and GTFG-FITC peptides. (B) AU4S was dissolved in 1 ml reaction buffer (50 mM Tris-HCl, pH 8.0, 2 mM DTT, 1.2 M sodium citrate) at the final concentration of 0.2 μM, and then detected with a PerkinElmer LS55 fluorescence spectrometer. The fluorescence spectrograms of AU4S with the excitation wavelengths at 480 nm, 488 nm, and 495 nm are shown (The emission wavelength is 521 nm). (C) Recombinant human ATG4 proteases (0.8 μM) including ATG4A, ATG4B, ATG4C and ATG4D were separately incubated with 0.2 μM AU4S, AG4R, or GTFG-FITC in the reaction buffer at 37 ℃ for 40 min in darkness. Then the fluorescence values were recorded with a fluorescence microplate reader in arbitrary units (a.u.) at excitation/emission wavelength 488 nm/521 nm. The fluorescence values of 0.2 μM peptides (AU4S, AG4R or GTFG/FITC) in reaction buffer without ATG4 proteases were considered as the corresponding background, which was subtracted accordingly. Data are mean ± SD from 3 experiments. n.s.: no significance; *: P < 0.05. (D and E) Different concentrations of recombinant ATG4B were separately incubated with 0.2 μM AU4S, AG4R, or GTFG-FITC for 40 min (D) or recombinant ATG4B (0.8 μM) was separately incubated with 0.2 μM AU4S, AG4R, or GTFG/FITC for the indicated times (E) in the reaction buffer at 37°C in darkness. Subsequently, the fluorescence values were recorded with a fluorescence microplate reader. The fluorescence values of 0.2 μM peptides (AU4S, AG4R or GTFG-FITC) in the reaction buffer without ATG4B were considered as the corresponding background, which was subtracted accordingly. Data are mean ± SD from 3 experiments.
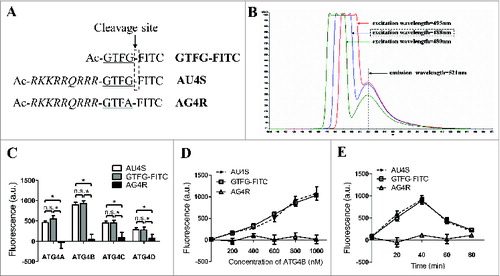
Figure 2. AU4S can be used to measure the activity of ATG4 in the lysates of cells and tissue. (A) After being cultured overnight in 6-well plates, NRK cells were harvested and lysed using the lysis buffer without protease inhibitors. Subsequently, 0.2 μM AU4S and AG4R were separately incubated with the cell lysates in 200 μl reaction buffer (50 mM Tris-HCl, pH 8.0, 5 mM DTT, 1.2 M sodium citrate) at 37 ℃ for 40 min in darkness. Then the fluorescence values were detected with a fluorescence microplate reader at excitation/emission wavelength 488 nm/521 nm. The fluorescence values of 0.2 μM AU4S and AG4R in the reaction buffer without cell lysates (but with equal volume of lysis buffer) were considered as the corresponding background. Data are mean ± SD from 3 experiments. n.s.: no significance; *: P < 0.05. (B) After treatment with or without 500 nM rapamycin for 6 h in 6-well plates, NRK cells were harvested and lysed. Then the lysates were used for immunoblot analysis of LC3B-II, taking GAPDH as a loading control. One representative set of data from 3 experiments is shown, and the ratio of LC3B-II/GAPDH was calculated. (C) The cell lysates derived from (B) were used for the detection of the fluorescence values in the presence of AU4S or AG4R as in (A). The F-D value (the difference between AU4S- and AG4R-measured fluorescence intensity in the same sample) was calculated and normalized by the amount of protein (a.u./mg protein). Data are mean ± SD from 3 experiments. *: P < 0.05. (D) Two SD rats (numbered as Rat 1 and 2) were separately fed with a standard laboratory food (for Rat 1) or starved (for Rat 2) for 48 h. Then the rats were sacrificed and the tissues including liver, skeletal muscle, heart, brain, and white blood cells (WBCs) were obtained and lysed. Subsequently, the lysates were used for immunoblot analysis of LC3B-II as in (B). Each tissue lysate was assayed by immunoblot 3 times, and one representative immunoblot is shown. Additionally, the ratio of LC3B-II/GAPDH was calculated. (E) Each tissue lysate derived from (D) was used for the measurement of F–D values as in (C) with AU4S and AG4R 3 times. Data are mean ± SD from 3 experiments. (F and G) The correlation between the F–D values and the corresponding ratios of LC3B-II/GAPDH in starved rat tissues (F, Rat 2,4,6) or control rat tissues (G, Rat 1,3,5) was respectively analyzed.
Figure 3. AU4S can efficiently enter living cells. (A and B) NRK (A) and Namalwa (B) cells were separately incubated with 1 μM AU4S or GTFG-FITC for the indicated times. Then the fluorescence intensity was observed under fluorescence microscopy, and the representative pictures are shown. DAPI was used to stain the nucleus. (C) After incubation with 1 μM AU4S or GTFG-FITC for the indicated times, NRK cells or Namalwa cells were washed 3 times with DMEM medium, and then resuspended in PBS. Subsequently, the fluorescence intensity in the cells was analyzed by flow cytometry, and the representative data are shown. (D and E) After an overnight incubation in complete medium, NRK (D) and Namalwa (E) cells were separately incubated with 0.5 μM AU4S, AG4R or GTFG-FITC in DMEM medium for the indicated times. Then the cells were resuspended in PBS after washed 3 times with medium. Subsequently, the fluorescence intensity was measured with a fluorescence microplate reader. Data are mean ± SD from 3 experiments. *: P <0.05.
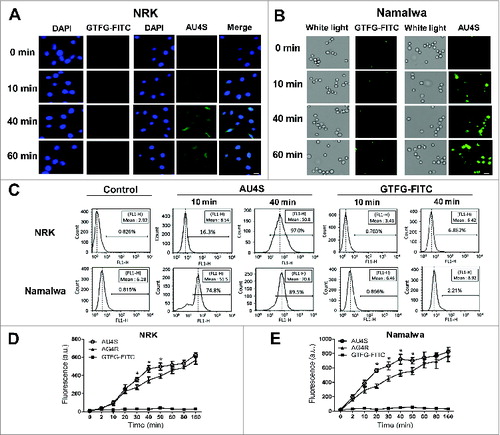
Figure 4. AU4S can be used to detect the activity of ATG4 in living cells. (A) After an overnight incubation in complete medium, NRK cells were cultured in DMEM medium at 37°C for the indicated times in darkness in the presence or absence of 0.5 μM AU4S or AG4R. Then the cells were resuspended in PBS after 3 washes with medium. Subsequently, the fluorescence intensity was analyzed by flow cytometry (FL1-H channel). Data from 3 experiments are presented in the line chart. The fluorescence value of 100 cells = the mean fluorescence value per cell × 100. The average fluorescence values from 3 experiments are also presented under the chart. (B) After pretreatment with 1 μM “Ac-RKKRRQRRR-GTFG” for 20 min, NRK cells were separately incubated with 0.5 μM AU4S and AG4R for 40 min at 37 ℃. Then the fluorescence intensity was analyzed by flow cytometry as in (A). Data from 3 experiments are presented. (C and D) After treatment with 0.5 μM rapamycin for 1 h or 3 h, NRK cells were cultured in DMEM medium with 0.5 μM AU4S or AG4R for 40 min. Then the cells were resuspended in PBS after 3 washes with medium. Subsequently, the fluorescence intensity was analyzed by flow cytometry (C) or fluorescence microplate measurements (D). The F-D value represents the difference between AU4S- and AG4R-measured fluorescence intensity in the same sample. In the flow cytometry analysis, the mean fluorescence value of 1×10⁴ cells was calculated. The fluorescence value of 100 cells = the mean fluorescence value per cell × 100. When detected with the fluorescence microplate reader, the F-D value was normalized by the amount of protein (a.u./mg protein). Data are mean ± SD from 3 experiments. (E and F) After an overnight incubation in complete medium, NRK cells were cultured in EBSS medium for 1 h or 3 h. Then the cells were incubated with 0.5 μM AU4S or AG4R for 40 min in DMEM medium. Subsequently, the cells were resuspended in PBS after washed 3 times with medium, and then the fluorescence intensity was analyzed by flow cytometry (E) or with a fluorescence microplate reader (F) as in (C) and (D), respectively. Data are mean ± SD from 3 experiments. (G and H) After treatment with 0.5 μM rapamycin for 1 h or 3 h, NRK cells were harvested and the level of LC3B-II was analyzed by immunoblot, using GAPDH as a loading control. The representative data are shown in (G), and the ratio of LC3B-II/GAPDH was calculated based on the data from 3 experiments (H). (I and J) After an overnight incubation in complete medium, NRK cells were cultured in EBSS medium for 1 h or 3 h. Then the cells were harvested and the level of LC3B-II was analyzed by immunoblot. The representative data are shown in (I), and the ratio of LC3B-II/GAPDH was calculated based on the data from 3 experiments (J). n.s.: no significance; *: P <0.05.
Figure 5. DTT can conditionally rescue the activity of ATG4 in starved cells. (A and B) After treatment with 0.5 μM rapamycin for the indicated times, NRK cells were incubated with DMEM medium in the presence or absence of 2 mM DTT for 40 min. Then the cells were incubated with 0.5 μM AU4S or AG4R for 40 min. Subsequently, the cells were resuspended in PBS after 3 washes with medium, and then the fluorescence intensity was detected by flow cytometry (A) or with a fluorescence microplate reader (B). The F-D values were calculated and normalized as in and 4D. (C and D) After an overnight incubation in complete medium, NRK cells were cultured in EBSS medium for the indicated times. Then the cells were incubated with DMEM medium in the presence or absence of 2 mM DTT for 40 min. Subsequently, the cells were incubated with 0.5 μM AU4S or AG4R for 40 min, and then the fluorescence intensity was examined by flow cytometry (C) or with a fluorescence microplate reader (D) as in (A) and (B) respectively. Data are mean ± SD from 3 experiments. n.s.: no significance; *: P <0.05.
Figure 6. The activity of ATG4 detected after DTT supplementation parallels the LC3B-II level in the presence or absence of autophagy inhibitors. (A to D) NRK cells were treated with EBSS for 3 h in the presence or absence of the autophagy inhibitor 3-MA (5 mM) (A and C) or CQ (20 μM) (B and D). Then the cells were incubated with DMEM medium for 40 min in the presence or absence of 2 mM DTT, followed by an incubation with 0.5 μM AU4S or AG4R for 40 min. Subsequently, the fluorescence intensity was measured with a fluorescence microplate reader, and the F-D value was calculated and normalized as in . Data are mean ± SD from 3 experiments. n.s.: no significance; *: P <0.05. (E and F) NRK cells were treated as in (A) and (B), then the level of LC3B-II was assayed by immunoblot, using GAPDH as a loading control. One representative data set from 3 experiments is shown, including the ratio of LC3B-II/GAPDH.
Figure 7. The activity of ATG4 detected after DTT supplementation is positively correlated with LC3B-II accumulation in peripheral WBCs from leukemia patients. (A and B) Peripheral WBCs from healthy donors (A) or leukemia patients (B) were cultured in DMEM medium in the presence or absence of 2 mM DTT for 40 min, and then incubated with 0.5 μM AU4S or AG4R at 37 ℃ for 40 min. Subsequently, the cells were resuspended in PBS after washed 3 times with medium, and the fluorescence values were detected with a fluorescence microplate reader. Then the F-D values were calculated and normalized as in . Data are mean ± SD from 3 experiments. (C and D) Peripheral WBCs from healthy donors (C) or leukemia patients (D) were lysed for the analysis of LC3B-II accumulation by immunoblot, using GAPDH as a loading control. One representative immunoblot data set from 3 experiments is shown, including the ratio of LC3B-II/GAPDH. (E and F) The correlations between the F-D values (from A and B) and the ratios of LC3B-II/GAPDH (from C and D) in peripheral WBCs of healthy donors (E) and leukemia patients (F) were analyzed separately. -DTT: the F–D value was assayed without DTT supplementation (E, a; F, a); +DTT: the F-D value was analyzed after DTT supplementation (E, b; F, b).