Figures & data
Figure 1. SIRT5 controls lysine succinylation and ammonia production. (A) MDA-MB-231 and C2C12 cells were transfected to obtain clones overexpressing (SIRT5+) and silenced (SIRT5-) for SIRT5. In addition, WT cells were treated for 24 h with the SIRT5 inhibitor MC3482 as described under Materials and Methods. Overexpression and silencing of SIRT5 was confirmed by western blot as shown in the upper inserts. Moreover, SIRT5 expression in the presence of the inhibitor MC3482 was also studied by western blot as shown in the lower inserts. Densitometric analysis of the gels was performed as described under Materials and Methods. Desuccinylasic activity of SIRT5 in WT, SIRT5 clones and WT cells treated with MC3482 was measured in mitochondrial extracts as described under Materials and Methods. Data are representative of at least 3 separate experiments. ACTB was used as loading control. *Significantly different from WT cells. Significance was set at P < 0.05. (B) Whole cellular extracts were obtained from MDA-MB-231 WT cells in the presence or absence of SIRT5 inhibitor MC3482 as well as from SIRT5+ and SIRT5- clones. Lysates were then subjected to SDS-PAGE and succinylation (left side) and acetylation (right side) levels of lysines measured by western blot by using a monoclonal anti-succinyl lysine and an anti-acetyl lysine antibody as described under Materials and Methods. Densitometric analysis of the gels was performed as described under Materials and Methods. Data are representative of at least 3 separate experiments. ACTB was used as loading control. *Significantly different from WT cells. Significance was set at P < 0.05. (C) MDA-MB-231 and C2C12 WT cells in the presence or absence of MC3482, as well as SIRT5+ and SIRT5- clones were kept in culture for the times indicated. Similarly, MDA-MB-231 and C2C12 cells overexpressing (SIRT3+) and silenced (SIRT3-) for SIRT3 were used. Ammonia levels were measured in the culture medium every other day as reported under Materials and Methods. Ammonia production in the absence of cells (1.6± 0.3 μg/ml and 0.4± 0.1 μg/ml in the presence and absence of glutamine respectively) was subtracted from each experiment. Data are representative of at least 3 separate experiments. *Significantly different from WT cells. Significance was set at P < 0.05.
Figure 2. SIRT5 coimmunoprecipitates and desuccinylates glutaminase. (A) MDA-MB-231 WT, SIRT5+ and SIRT5- cells were processed to obtain whole cellular extracts. Glutaminase and glutamine synthetase levels were assessed by western blot as indicated under Materials and Methods. Densitometric analysis of the gels was performed as described under Materials and Methods. Data are representative of at least 3 separate experiments. ACTB was used as loading control. *Significantly different from WT cells. Significance was set at P < 0.05. (B) MDA-MB-231 WT cells, either treated with MC3482 or left untreated, as well as SIRT5+ cells were processed. Cellular extracts were immunoprecipitated with either an anti-glutaminase antibody or anti-rabbit IgG, electrophoresed on a SDS-polyacrylamide gel and immunoblotted with an anti-SIRT5, anti-succinyl lysine or anti-glutaminase antibody as described under Materials and Methods. GLS expression was also determined in the input (lower panel). Densitometric analysis of the gels was performed as described under Materials and Methods. Data are representative of at least 3 separate experiments. ACTB was used as loading control. *Significantly different from WT cells. Significance was set at P < 0.05. (C) MDA-MB-231 WT cells, either treated with MC3482 or left untreated, as well as SIRT5+ and SIRT5- cells were processed. Cellular extracts were immunoprecipitated with either an anti-SIRT5 antibody or anti-rabbit IgG, electrophoresed on a SDS-polyacrylamide gel and immunoblotted with an anti-glutaminase, anti-succinyl lysine or anti-SIRT5 antibody as described under Materials and Methods. Densitometric analysis of the gels was performed as described under Materials and Methods. Data are representative of at least 3 separate experiments. ACTB was used as loading control. *Significantly different from WT cells. Significance was set at P < 0.05.
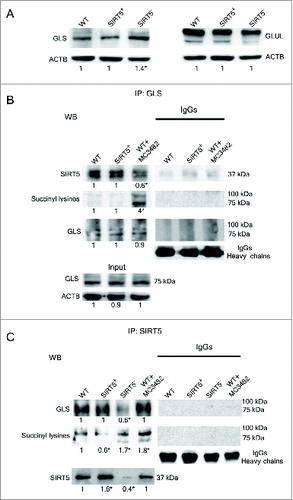
Figure 3. SIRT5 controls glutamate accumulation. (A) MDA-MB-231 and C2C12 WT cells, either treated with MC3482 or left untreated, as well as SIRT5+ and SIRT5- cells were processed to obtain whole cellular extracts. Glutamate concentration was measured using a glutamate assay kit according to manufacturer's protocol. Alternatively, glutamate was also measured in MDA-MB-231cells treated with the GLS inhibitor BPTES for 17 h. Data are representative of at least 3 separate experiments. *Significantly different from WT cells. Significance was set at P < 0.05. (B) MDA-MB-231 and C2C12 WT cells in the presence or absence of MC3482, as well as SIRT5+ and SIRT5- clones were kept in culture for the times indicated. In addition cells were also treated with the GLS inhibitor BPTES or with dimethyl-α-ketoglutarate to replenish anaplerotic flux. Ammonia levels were measured in the culture medium after 2 and 3 d as reported under Materials and Methods. Data are representative of at least 3 separate experiments. *Significantly different from nontreated (NT) cells. Significance was set at P < 0.05.
Figure 4. SIRT5 silencing or inhibition induces autophagy. MDA-MB-231 WT cells, either treated with MC3482 or left untreated, as well as SIRT5+ and SIRT5- cells were cultured for 24 h. The cells were then processed for electron microscopy as described under Materials and Methods. (A) WT control showing a few autophagosomes (magnification 21,000x). (B) SIRT5-overexpressing cells with very low or absent autophagy (Magnification 21,000x). (C) Autophagy in WT cells treated with MC3482. Black arrows point to autolysosomes in the cytoplasm (magnification 21,000x). (D) Autophagy in SIRT5-silenced cells. Black arrows point to autophagosomes and autolysosomes (magnification 15,500x). Inset Magnification 28,500x.
Figure 5 (See previous page). SIRT5 controls ammonia-induced autophagy. (A) MDA-MB-231 WT cells in the presence or absence of MC3482, as well as SIRT5+ and SIRT5− clones were processed to obtain whole cellular extracts. Alternatively, WT, SIRT5+ and SIRT5− cells were treated with 100 nM bafilomycinA1 for 2 and 17 h and processed. Finally, also MDA-MB-231 WT, SIRT3+ and SIRT3− cells were used. Autophagy induction was measured by using an anti-MAP1LC3B antibody as indicated under Materials and Methods. Densitometric analysis of the gels was performed as described under Materials and Methods. ACTB was used as loading control. *Significantly different from WT cells. Significance was set at P < 0.05. (B) MDA-MB-231 WT cells in the presence or absence of MC3482, as well as SIRT5+ and SIRT5− clones were processed to obtain whole cell extracts. SQSTM1, GABARAPL2, and GABARAP levels were determined by western blot as indicated under Materials and Methods. In addition, cells were treated with bafilomycinA1 for 17 h and SQSTM1 levels measured by western blot. Densitometric analysis of the gels was performed as described under Materials and Methods. ACTB was used as loading control. *Significantly different from WT cells. Significance was set at P < 0.05. (C) MDA-MB-231 WT cells were either left untreated or treated with NH4Cl 1 or 2 mM for 24 h. Subsequently, cells were processed to obtain whole extracts. MAP1LC3B, GABARAPL2, GABARAP and, SQSTM1 levels were measured by western blot as indicated under Materials and Methods. Densitometric analysis of the gels was performed as described under Materials and Methods. ACTB was used as loading control. *Significantly different from WT cells. Significance was set at P < 0.05. (D) MDA-MB-231 WT cells in the presence or absence of MC3482, as well as SIRT5+ and SIRT5− clones were treated with either BPTES or dimethyl-α-ketoglutarate. Cells were then processed to obtain whole extracts. MAP1LC3B, GABARAPL2, and, SQSTM1 levels were measured by western blot as indicated under Materials and Methods. Densitometric analysis of the gels was performed as described under Materials and Methods. ACTB was used as loading control. *Significantly different from WT cells. Significance was set at P < 0.05. (E) MDA-MB-231 WT cells in the presence or absence of MC3482, as well as SIRT5+ and SIRT5− clones were cultured without L-glutamine for 24 h. Cells were then processed to obtain whole extracts. MAP1LC3B and SQSTM1 levels were measured by western blot as indicated under Materials and Methods. Densitometric analysis of the gels was performed as described under Materials and Methods. ACTB was used as loading control. *Significantly different from WT cells. Significance was set at P < 0.05. (F) C2C12 WT cells treated in the presence or absence of MC3482, as well as SIRT5+ and SIRT5− clones were processed to obtain whole cell extracts. Cells were also treated with NH4Cl 1 or 2 mM for 24 h. To asses autophagy induction MAP1LC3B, GABARAPL2, and GABARAP levels were determined by western blot as indicated under Materials and Methods. Densitometric analysis of the gels was performed as described under Materials and Methods. ACTB was used as loading control. *Significantly different from WT cells. Significance was set at P < 0.05.
Figure 6. Ammonia increases proteolysis of long-lived proteins. (A) MDA-MB-231 WT cells were labeled with AHA as described under Materials and Methods and then cultured in complete medium in the presence or absence of 2 mM NH4Cl, 10 mM NH4Cl or 50 μM MC3482 for 3 h. Alternatively, cells were cultured in starvation medium in the presence or absence of 10 mM NH4Cl for 3 h. Cells were then fixed, permeabilized and stained for 2 h with alkine-Alexa Fluor 488 as described under Materials and Methods. Fluorescence from long-lived proteins was observed using a LSM 510 confocal microscopy (Zeiss). (B) MDA-MB-231 and C2C12 WT cells were placed in a 96-well plate, labeled and treated as described in (A). However, C2C12 cells treatments were prolonged to 6 h. Fluorescence from labeled long-lived proteins was measured using Glomax multi detection system (Promega). The fluorescence intensity of the assay buffer was subtracted from each experimental sample. *Significantly different from control (ctrl) cells. #Significantly different from control starved (ctrl) cells. Significance was set at P < 0.05.
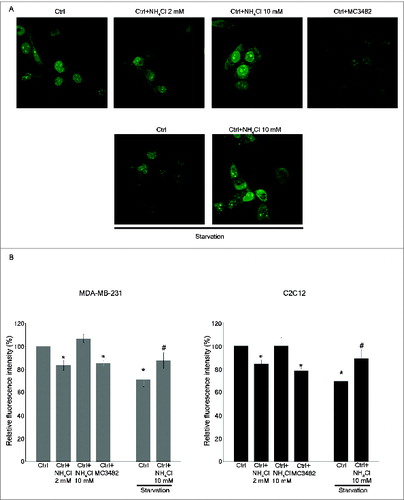
Figure 7. SIRT5 controls ammonia-induced mitophagy and mitochondrial fusion proteins. (A) Upper panel: MDA-MB-231 WT cells in the presence or absence of MC3482, as well as SIRT5+ and SIRT5− clones were processed to obtain mitochondrial fractions. Alternatively, WT, SIRT5+ and SIRT5− cells were treated with 100 nM bafilomycinA1, BPTES, dimethyl-α-ketoglutarate, NH4Cl or grown without L-glutamine for 17 h and processed. BNIP3 expression levels were determined by western blot as indicated under Materials and Methods. Densitometric analysis of the gels was performed as described under Materials and Methods. COX4I1 was used as a loading control. *Significantly different from WT cells. Significance was set at P < 0.05. Middle panel: MDA-MB-231 WT cells in the presence or absence of MC3482, as well as SIRT5+ and SIRT5− clones were processed to obtain mitochondrial fractions. Alternatively, WT, SIRT5+ and SIRT5− cells were treated with NH4Cl for 17 h. PINK1 and PARK2 levels were assessed by western blot as indicated under Materials and Methods. Densitometric analysis of the gels was performed as described under Materials and Methods. COX4I1 was used as a loading control. *Significantly different from WT cells. Significance was set at P < 0.05. Lower panel: MDA-MB-231 WT cells in the presence or absence of MC3482, as well as SIRT5+ and SIRT5− clones were processed to obtain whole cellular extracts. MFN2 and OPA1 levels were assessed by western blot as indicated under Materials and Methods. Densitometric analysis of the gels was performed as described under Materials and Methods. ACTB was used as loading control. Data are representative of at least 3 separate experiments. *Significantly different from WT cells. Significance was set at P < 0.05. (B) Upper panel: C2C12 WT cells in the presence or absence of MC3482, as well as SIRT5+ and SIRT5− clones were processed to obtain mitochondrial fractions. Alternatively, WT, SIRT5+ and SIRT5− cells were treated with NH4Cl for 17 h. BNIP3 expression levels were determined by western blot as indicated under Materials and Methods. Densitometric analysis of the gels was performed as described under Materials and Methods. COX4I1 was used as a loading control. *Significantly different from WT cells. Significance was set at P < 0.05. Lower panel: C2C12 WT cells in the presence or absence of MC3482, as well as SIRT5+ and SIRT5− clones were processed to obtain whole cellular extracts. MFN2 and OPA1 levels were assessed by western blot as indicated under Materials and Methods. Densitometric analysis of the gels was performed as described under Materials and Methods. ACTB was used as loading control. Data are representative of at least 3 separate experiments. *Significantly different from WT cells. Significance was set at P < 0.05.
Figure 8. Mitochondrial morphology, membrane potential, ATP and lactate levels in WT cells and in SIRT5 clones. (A) MDA-MB-231 and C2C12 WT, SIRT5+ and SIRT5- cells as well as WT cells treated with NH4Cl for 24 h were incubated with JC-1 to assess mitochondrial membrane potential as described under Material and Methods. Pictures of mitochondria were taken at 60x with a LSM510 Zeiss Confocal Microscope. (B) Left side. MDA-MB-231 WT cells, either treated with MC3482 or left untreated, as well as SIRT5+ and SIRT5- cells were processed to obtain whole cellular extracts. ATP levels were measured using an ATP/ADP assay kit according to the manufacturer's protocol. Alternatively, ATP levels were also measured in the presence of the glycolysis inhibitor 2DG for 17 h. Data are representative of at least 3 separate experiments. *Significantly different from non treated cells. #Significantly different from WT and SIRT5+ cells treated with 2DG (P < 0.01). Significance was set at P < 0.05. Right side. MDA-MB-231 cells in the presence or absence of MC3482, as well as SIRT5+ and SIRT5- clones were kept in culture for 3 d Lactate levels were measured in the culture medium as reported under Materials and Methods. Data are representative of at least 3 separate experiments. *Significantly different from WT cells. Significance was set at P < 0.05.
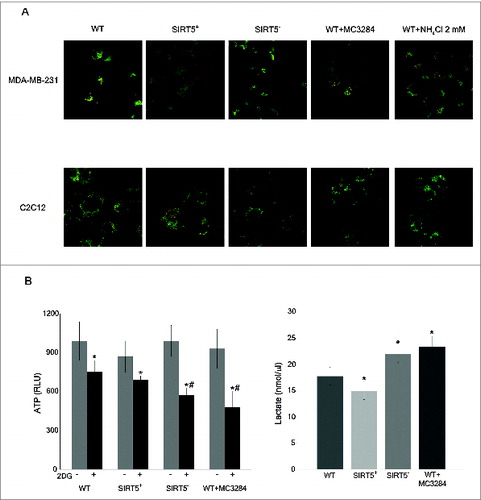
Figure 9. Mitochondrial fusion in WT cells and in SIRT5 clones. Two separate populations of C2C12 WT, or SIRT5+ or SIRT5- cells were incubated with either MitoTrackerGreen or MitoTrackerRed. Subsequently the 2 populations were cocultured in the presence of PEG to stimulate cellular fusion as described under Materials and Methods. Cells with green-labeled mitochondria fused with cells with red-labeled mitochondria were analyzed under confocal microscope (LSM510 Zeiss). The presence of mitochondria fusion was assessed by the appearance of yellow mitochondria. Pictures on the right side are enlargements of the images in the white box on the left. White arrows in the lower right panel indicate the presence of large fused or fusing mitochondria. Pictures of mitochondria were taken at 60x with a LSM510 Zeiss Confocal Microscope.
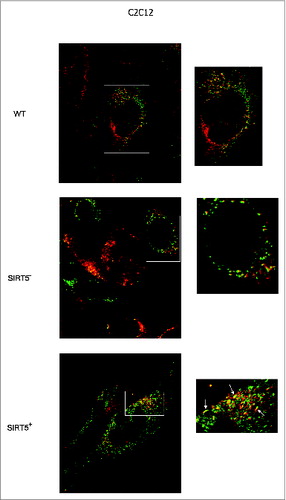
Figure 10. Schematic representation of SIRT5 control of glutamine metabolism and ammonia-induced autophagy and mitophagy. SIRT5 controls ammonia-induced autophagy and mitophagy by regulating glutamine metabolism.