Figures & data
Figure 1. Cisplatin induces autophagic flux in cisplatin-resistant cells. (A) Cells were treated with cisplatin at indicated doses for 12 h in the presence or absence of 10 μM chloroquine (CQ). Upper panels: LC3 protein levels were determined by western blotting. Lower panels: the autophagic flux was quantified by the fold change in LC3-II levels in the presence or absence of CQ. The experiments were performed in triplicate. * Indicates significant difference compared with control (P < 0.05). (B) A2780/CP70 cells were transfected with a GFP-LC3 plasmid for 48 h, followed by cisplatin (25 μM) and/or chloroquine (10 μM) treatments for 12 h. LC3 puncta was observed with fluorescence microscopy. Representative images captured by a fluorescence microscope are shown. Scale bar = 80 μm. Data were quantified as the percentage of puncta-positive cells in total GFP positive cells. (C) Cells were treated with cisplatin as described above. The protein levels of SQSTM1, MTOR, p-RPS6KB1, RPS6KB1 were determined by western blotting.
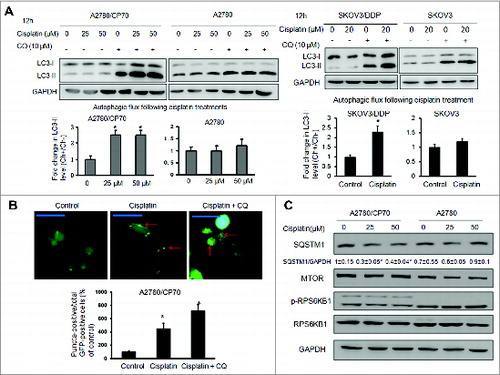
Figure 2. The MIR152 mimic sensitizes ovarian cancer cells to cisplatin-mediated cell death. (A) MIR152 expression levels in A2780/CP70, A2780, SKOV3 and SKOV3/DDP cells were determined by Taqman RT-PCR. (B) Cells were transfected with the MIR152 mimic or miR-control MIR-C for 48 h and reseeded into 96-well plates followed by cisplatin treatments at various concentrations for 72 h. Cell viability was measured by MTT assay. The IC50 of cisplatin in these cells was presented as mean ± SD. * Indicates significant difference compared with control (P < 0.05). (C) A2780/CP70 cells were transfected with the MIR152 mimic or control MIR-C for 48 h, followed by cisplatin treatments (50 μM, 12 h). A2780 cells were transfected with ANTI-152 or control ANTI-C for 48 h, followed by cisplatin (25 μM, 12 h) treatments. Cell death was measured by ANXA5 and PI staining. The number of apoptotic and secondary necrotic cells is shown as the sum of ANXA5-positive and ANXA5 and PI double-positive cells and is presented as mean ± SD from 3 independent experiments. * Indicates significant difference compared with MIR-C without cisplatin treatment (P<0.05). # Indicates significant difference compared with MIR152 without cisplatin treatment (P < 0.05).
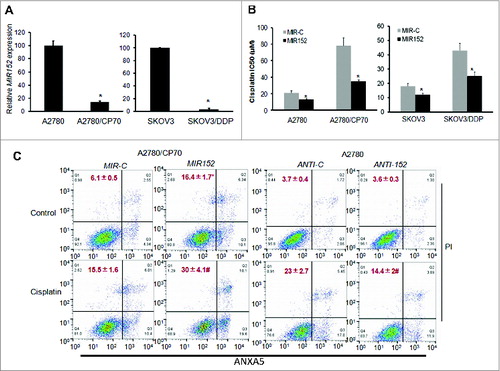
Figure 3. Overexpression of MIR152 inhibits cisplatin-induced autophagy in A2780/CP70 cells. (A) A2780/CP70 cells stably expressing MIR152 or MIR-C were treated with cisplatin (25 μM, 12 h) in the presence or absence of chloroquine (CQ). LC3 protein levels were determined by western blotting. Data were quantified as described in Fig.1 A. (B) Upper left: A2780/CP70 cells stably expressing MIR152 or MIR-C were transfected with the GFP-LC3 plasmid for 48 h, and followed by cisplatin treatment (25 μM) for 12 h. Upper right: SKOV3/DDP cells were transiently transfected with the GFP-LC3 plasmid and MIR152/ MIR-C for 48 h and this was followed by cisplatin treatment (20 μM) for 12 h. Representative images captured with a fluorescence microscope are shown. Scale bar = 80 μm. Lower: The percentage of GFP-LC3 puncta-positive cells was quantified as described in Fig.1B. (C, D) A2780/CP70-MIR-C cells or A2780/CP70-MIR152 cells were injected in the flank of nude mice. Mice were treated 3 times a wk with control solvent (1% DMSO) or cisplatin (3 mg/kg, i.p.) initiated 3 d after the cell injection. Representative tumors are shown (C). Tumor volumes were measured and expressed as mean ± SEM (n = 8 to 10)(D). *P < 0.05.
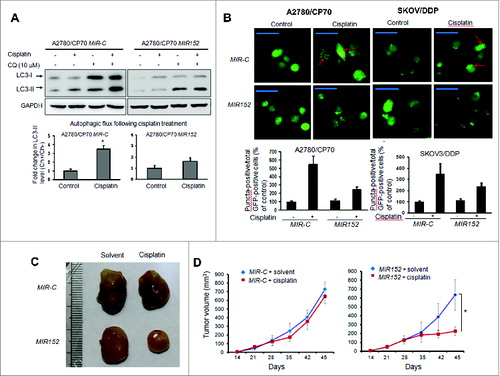
Figure 4. MIR152 directly targets ATG14. (A) Sequence alignment of 3’UTR of ATG14 mRNA and human MIR152 with potential binding sites. (B) 293T cells and A2780 cells were cotransfected with ATG14 3’UTR wild-type or mutant luciferase reporter, MIR152 mimic or negative control MIR-C and β-gal plasmid for 48 h, then harvested for the luciferase activity assay. The luciferase activities were presented as relative luciferase activities normalized to those of the cells cotransfected with wild-type 3’UTR reporter and miR-control. *Indicates significant difference compared with control (P < 0.05). All tests were performed in triplicate and presented as mean ± SD. (C) A2780/CP70 cells and A2780 cells were transiently transfected with 25 μM MIR152 mimic or MIR-C for 72 h. A2780 cells were transiently transfected with 25 μM ANTI-152 or control ANTI-C for 72 h. ATG14 expression was determined by western blotting. (D) A2780/CP70 cells were treated with cisplatin at indicated doses for 12 h. ATG14 protein levels were determined by western blotting.
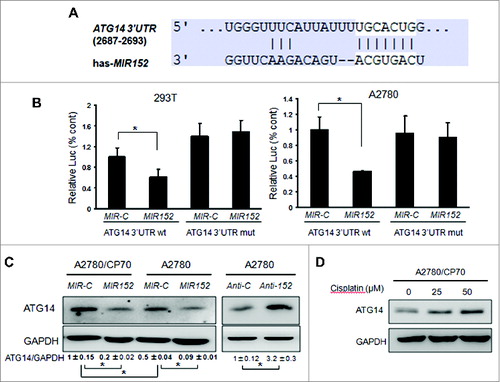
Figure 5. Knockdown of ATG14 inhibits basal autophagy and promotes cisplatin-induced inhibition of cell proliferation and cell death. (A) A2780/CP70 and SKOV3/DDP cells were transiently transfected with 50 nM siATG14 Smartpool or negative siRNA control for 72 h. ATG14 and LC3 expression levels were determined by western blotting. (B) A2780/CP70 cells were transfected with siATG14 Smartpool or negative siRNA control for 48 h, and reseeded into 96-well plates treated with 25 μM cisplatin for 72 h. MTT assay was performed at the indicated time points. * Indicates significant difference compared with siRNA control at the same time point. (C) A2780/CP70 cells were treated with cisplatin (25 μM) with or without chloroquine (CQ, 10 μM) for 12 h, or transfected with siATG14, siATG7, or siRNA control for 48 h, followed by cisplatin treatments (25 μM, 12 h). Cell apoptosis was measured by ANXA5 and PI staining. The number of apoptotic and secondary necrotic cells is shown as the sum of ANXA5-positive and ANXA5 and PI double-positive cells and is presented as mean ± SD from 3 independent experiments. * Indicates significant difference compared with control or sicont (P < 0.05).
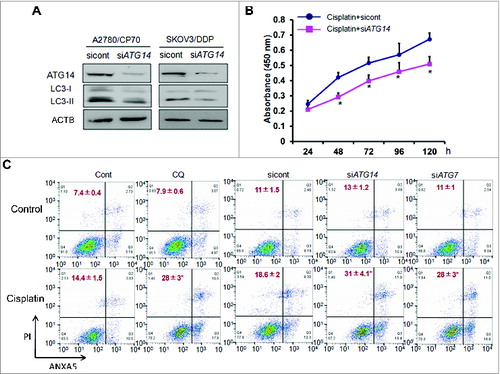
Figure 6. Downregulation of EGR1 mediates cisplatin-resistance through MIR152 at the transcriptional level. (A) EGR1 protein levels were determined by western blotting in cells. (B) Upper: sequence alignment of the MIR152 gene promoter containing EGR1 consensus DNA-binding sites. Lower: The biotin end-labeled MIR152 promoter DNA fragment was incubated with or without A2780 nuclear extraction and an excess (100-fold) unlabeled DNA fragment. The EMSA assay was performed as described in Materials and Methods. (C) A2780 cells were transiently transfected with a siEGR1 Smartpool or a negative siRNA control for 72 h. MIR152 expression was determined by Taqman RT-PCR. (D) A2780/CP70 cells were transiently transfected with an EGR1 plasmid for 72 h. MIR152 expression was determined by Taqman RT-PCR. Data are presented as mean ± SD. * Indicates significant difference compared with control (P < 0.05). (E) A2780 cells were transiently transfected with a siEGR1 Smartpool or a negative siRNA control for 72 h. EGR1 and ATG14 expression levels were determined by western blotting. (F) A2780/CP70 cells were transfected with the EGR1 plasmid for 48 h, and reseeded into 96-well plates followed by cisplatin treatments at various concentrations for 72 h. Cell viability was measured by MTT assay. *Indicates significant difference compared with control at the same time point (P < 0.05).
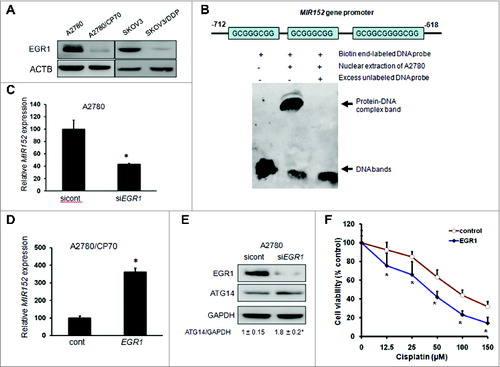
Table 1. Patient characteristics.
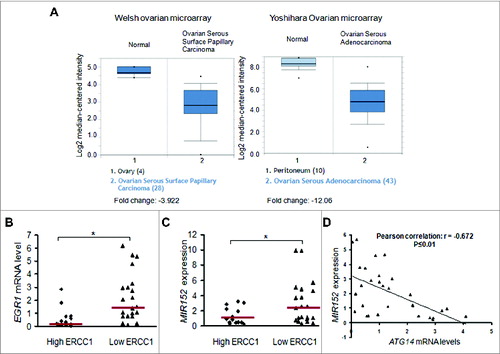
Figure 7. Lower levels of EGR1 and MIR152 in ovarian tumors are associated with cisplatin-resistance. (A) EGR1 expression levels in normal ovarian tissues vs. ovarian cancer tissues in 2 individual microarrays were shown using the Oncomine gene expression tool. (B) EGR1 mRNA levels were determined by SYBR-Green RT-PCR in 14 high ERCC1 ovarian tumors (ERCC1 score ≥ 1) and 21 low ERCC1 ovarian tumors (ERCC score < 1). Bars are indicated as median of the group. (C) MIR152 expression levels were determined by Taqman RT-PCR in 14 high ERCC1 ovarian cancer tissues and 21 low ERCC1 ovarian cancer tissues. Bars are indicated as the median of the group. *Indicates significant difference (P < 0.05). (D) ATG14 mRNA levels were determined by SYBR-Green RT-PCR in 30 ovarian tumors. Correlation analysis between MIR152 and ATG14 levels in human ovarian cancer tissues was performed.