Figures & data
Figure 1. HFD-induced obesity inhibits macrophage autophagy. (A) Immunoblots of total protein from BMDM from wild-type C57 BL/6 mice fed CD or HFD for 16 or 20 wk. Some cells were treated with ammonium chloride and leupeptin (AC/Leup) for 2 h. Proteins were probed for LC3B and tubulin, and LC3B-I and LC3B-II bands are indicated by arrows. (B) Quantification of the ratio of LC3B-II in ammonium chloride- and leupeptin-treated cells to untreated cells from CD- and HFD-fed BMDM from 20-wk-old animals by densitometric scanning of immunoblots (n = 4). Data presented as the mean ± SEM. *P < 0.003 as compared to control. (C) Western blots of total protein from BMDM from CD- or HFD-fed mice infected with GFP-LC3 adenovirus that were untreated or treated with LPS and IFNG for 8 h probed for GFP and tubulin. The GFP-LC3 and free GFP bands are highlighted with arrows. (D) Confocal images of GFP-LC3 puncta in BMDM from CD- and HFD-fed mice. (E to G) Quantification of GFP-LC3 puncta number, area and intensity in the BMDM from these mice (n = 9 to 13). (H) Western blots of total protein from peritoneal macrophages isolated from CD- and HFD-fed mice untreated or ammonium chloride and leupeptin-treated for 2 h.
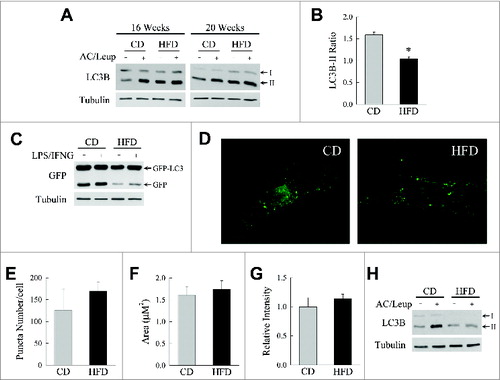
Figure 2. Loss of ATG5-dependent macrophage autophagy increases M1 polarization. ((A)to E) Relative mRNA levels of Nos2, Ptgs2, Tnf, Ccl5, and Il6 in BMDM from littermate control (Con) and atg5myeΔ knockout (KO) mice 12 h after treatment with LPS and IFNG (n = 4). (F) Immunoblots of total protein isolates from control and knockout BMDM treated with LPS and IFNG for the indicated number of hours and probed for the total and phosphorylated (P-) proteins shown. (G to K) Levels of TNF, CCL5, IL6, CCL2, and IL1B secreted into the culture medium by control and knockout BMDM with no treatment (No Tx) or stimulated with LPS and IFNG (M1) for 24 h (n = 6 to 8). All data are presented as the mean ± SEM. *P < 0.05 and **P < 0.01 versus control cells with the same treatment.
Figure 3. Atg5-deficient macrophages undergo decreased M2 polarization. (A to D) Relative mRNA levels of Retnla, Arg1, Chil3, and Mgl2 in BMDM from littermate control (Con) and atg5myeΔ knockout (KO) mice 12 h after treatment with IL4 and IL13 (n = 4). (E to H) Relative mRNA levels of Retnla, Arg1, Chil3, and Mgl2 in control and knockout BMDM 24 h after treatment with IL4 and IL13 (n = 6 to 12). All data are presented as the mean ± SEM. *P < 0.01 and **P < 0.00001 vs. control BMDM. (I) Immunoblots of total protein isolates from control and knockout BMDM treated with IL4 and IL13 for the number of hours shown and probed for the indicated total and phosphorylated (P-) proteins.
Figure 4. Metabolic effects of the knockout of Atg5 in macrophages with HFD feeding and LPS. (A) Body weights of littermate control (Con) and atg5myeΔ knockout (KO) mice after 12 wk of CD or HFD feeding (n = 21 to 26). (B) Change in body weight after 2 wk of phosphate-buffered saline (PBS) or LPS injections (n = 9 to 13). (C) Caloric intake in the different groups of mice (n = 4 or 5). (D) Serum β-hydroxybutyrate levels (n = 3 to 7). (E) Serum glucose levels (n = 9 to 13). (F) Histological grades of steatosis (n = 5 to 8). (G) Liver triglyceride content (n = 9 to 13). All data are presented as the mean ± SEM. *P < 0.05 and **P < 0.01 versus CD-fed, PBS-treated littermate control mice.##P < 0.01 vs. littermate control mice with the same diet and treatment.
Figure 5. atg5-knockout mice exhibit evidence of systemic inflammation. (A) Serum white blood cell (WBC) counts (n = 4 to 6). (B) Serum monocyte counts (n = 4 to 6). (C to I) Serum levels of TNF, IL6, CCL2, IL1B, IL4, IL10 and IL13 (n = 6 to 10). All data are presented as the mean ± SEM. *P < 0.05 and **P < 0.01 versus CD-fed, PBS-treated littermate control mice.#P < 0.05 vs. littermate control mice with the same diet and treatment.
Figure 6. HFD-fed, LPS-injected knockout mice have increased hepatic inflammation. (A, B) Relative levels of Emr1 and Ly6 g mRNA in the livers of CD- and HFD-fed mice treated with PBS or LPS (n = 4 to 6). (C) Immunofluorescence staining for CD68 in livers (200 × magnification). Enlarged images are shown in the inserts. (D) Numbers of CD68+ cells per field (n = 3). (E to I) Relative hepatic mRNA levels for Tnf, Ccl2, Ifng, Nos2, and Il1b (n = 4 to 6). All data are presented as the mean ± SEM. *P < 0.05 and **P < 0.01 versus CD-fed, PBS-treated littermate control mice. #P < 0.05 and ##P < 0.01 vs. littermate control mice with the same diet and treatment.
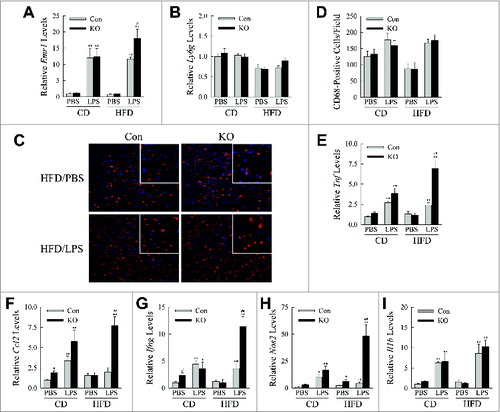
Figure 7. Autophagy regulates Kupffer cell M1 and M2 polarization. (A to D) Relative mRNA levels in Kupffer cells from control (Con) and knockout (KO) mice for Nos2, Ptgs2, Tnf and Ccl5 in response to LPS and IFNG treatment for 12 h. (E to G) mRNA levels 12 h after IL4 and IL13-induced M2 polarization for Retnla, Arg1, and Chil3 (n = 3). All data are presented as the mean ± SEM. *P < 0.05, **P < 0.01 versus control mice.
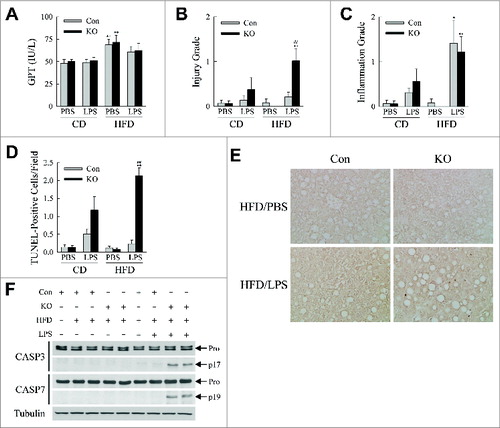
Figure 8. HFD-fed, LPS-treated knockout mice develop liver injury. (A) Serum GPTs in CD- and HFD-fed mice treated with PBS or LPS. (B) Histological grades of liver injury in the same mice. (C) Histological grades of hepatic inflammation. (D) Numbers of TUNEL-positive cells per field (400× magnification) (n = 6 to 8). All data are presented as the mean ± SEM. *P < 0.05 and **P < 0.01 vs. CD-fed, PBS-treated littermate control mice.##P < 0.01 versus littermate control mice with the same diet and treatment. (E) Representative TUNEL staining (400× magnification). (F) Immunoblots of total hepatic protein from CD- and HFD-fed control and knockout mice that were PBS- (-LPS) or LPS (+LPS) treated. Immunoblots were probed with antibodies for CASP3/caspase 3, CASP7/caspase 7 and tubulin. Arrows indicate the procaspase (Pro), the cleaved CASP3 (p17) and the cleaved CASP7 (p19) forms. The images with the cleaved forms are longer exposures of the procaspase immunoblots.