Figures & data
Figure 1. Immunofluorescence micrographs showing that the phagophore marker WIPI2 colocalizes with organelle markers TFRC, LAMP1, SEC31A, and GOLGA2. (A) Clear overlapping of the 2 labels was counted as a colocalization event (arrows). Scale bars: 10 μm. (B) Percentage of WIPI2 puncta positive for the organelle markers. Chart and error bars show the mean and SEM from 17 to 26 cells.
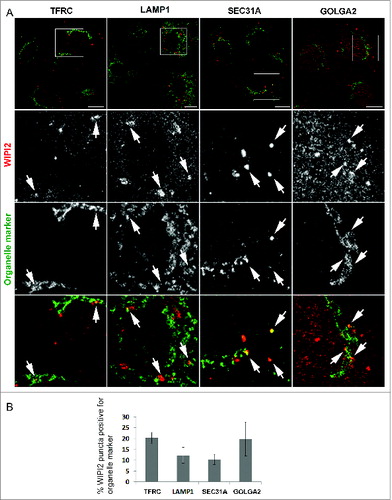
Figure 2. Immunolabeling at the electron microscope level showing that LC3-positive phagophores and early autophagosomes are found in close proximity to mitochondria, ER, putative ER exit sites, Golgi complex and late or recycling endosomes or lysosomes. LC3-positive structures (green arrowheads) with the morphology of phagophores or early autophagosomes are found very close to a mitochondrion (m) (A and B, F), close to the ER (B to D, F), close to a putative ER exit site (ERe and yellow arrowheads) (C and D), close to a Golgi complex (Go) (E), and close to a recycling or late endosome, or a lysosome (le) (F). Percentage of LC3-positive phagophores and early autophagosomes lying in close proximity to other organelles (G). A total of 51 LC3-positive structures were scored for this analysis.
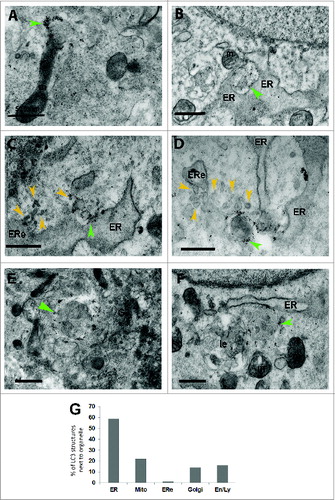
Figure 3. SB-EM reveals the spatial localization of phagophores and autophagosomes in whole cells. (A) Micrograph of SB-EM showing the overview of the cell with phagophores present (box outline depicts 1 of them). Inserts show 1 phagophore of interest, which is identified as an electron-dense open c-shaped structure, and the sequential SB-EM slices of the same phagophore are numbered. Orange arrow in the inserts depicts a mitochondrion in close proximity to the phagophore; the red arrows depict ER in close proximity to the phagophore. Figures S1 and S2 show serial images and a 3D model of additional phagophores and other organelles from this same cell. n, nucleus. (B) A 3D model of the SB-EM data shown in panel (A), and the spatial distribution of some of the phagophores within the cell. The color codes are assigned as follows; phagophores (ph) are green, the ER (ER) is red, plasma membrane is orange, mitochondria (m) are brown, endosomes or lysosomes are blue, nuclei (n) are pink and autophagosomes are yellow. The insert depicts the close communication between the phagophore and adjoining ER and mitochondria. Movies S1 and S2 show this same dataset.
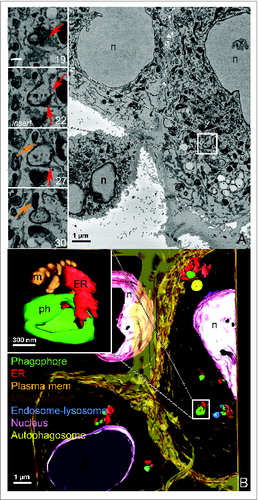
Figure 4. One phagophore can have simultaneous contacts with several organelles. Tomographic slices (1.6 to 2 nm) of a phagophore surrounded by several organelles (B and C, E–G) and the corresponding 3D model (D, H). (A) Electron micrograph taken from the 250-nm section showing the phagophore and associated organelles. The phagophore (ph) is visible as a dark curved membrane. The dark blue arrowheads indicate the contour of the late endosome or lysosome (le) below the phagophore. A dark structure inside the late endosome or lysosome is connected with the phagophore by a narrow dark line. Go indicates the Golgi apparatus. The boxed area was used for the tomography. Tomographic slices reveal that the electron-dense c-shaped phagophore is lying between the inside (red *) and outer (yellow **) ER sheets (B–E). Red arrows depict the membrane contact sites between the phagophore and the inside ER (B and C) and the yellow arrow indicates contact between the phagophore and an ER membrane next to the long tail of the phagophore (F). A putative ER exit site (ERe) which is depicted as an area of ER void of ribosomes, made up of tubular and sheet-like morphology and containing coated buds (c in panel F insert), putative COPII coated buds, is found on the right hand side of the phagophore (B and C, E–H). Coated vesicles (v) are seen next to the putative ER exit site (F insert, G and H). Blue arrows indicate membrane contacts between the phagophore and the putative ER exit site (B, E and F). In addition to the characteristic cup shape, the phagophore has an elongated tail portion of the membrane indicated by green arrowheads (E–G). The tail portion of the phagophore communicates with the thin cisterna of the Golgi complex (Go) as is indicated by light blue arrowheads (G, insert). The Golgi cisterna bends toward the phagophore and touches it, while the phagophore forms a dent in the area contacting the cisterna. The purple arrowheads indicate membrane continuity between the phagophore and the electron-dense structure contained within the lumen of the late endosome or lysosome (E, G and H). The limiting membrane of the late endosome or lysosome (G, dark blue arrowhead) forms a tunnel through which the dark structure reaches out of the late endosome or lysosome (E, G and H, insert) and communicates with the phagophore. Color code in panel H: green, phagophore; red and yellow, ER; gold, putative ER exit site; light blue, Golgi apparatus; purple, late endosome or lysosome limiting membrane; dark blue, electron-dense structure inside the late endosome or lysosome. Figure S5 shows the serial slices through the membrane continuity of the phagophore and the dark structure inside the late endosome or lysosome.
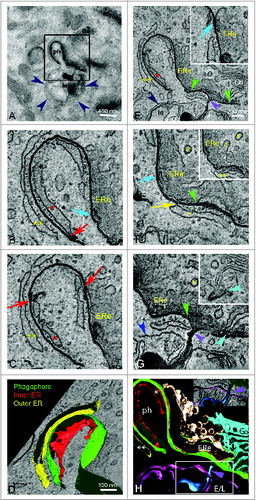
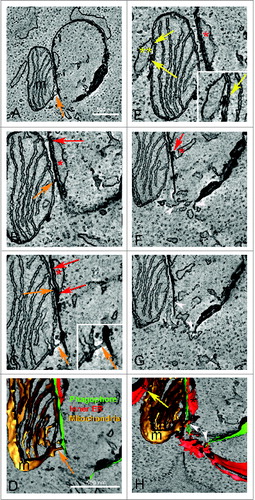
Figure 5. One phagophore can have contacts with both ER and a mitochondrion. Tomographic slices (1.6 to 2 nm) of the phagophore and its communication with a mitochondrion (A–C), contacts between the mitochondrion with ER (E), and the corresponding 3D models (D, H). (A) The electron-dense c-shape of the phagophore is found in close proximity to a mitochondrion (m). Membrane contact sites (orange arrows) depicted as membrane bridges are evident between the phagophore and the outer mitochondrial membrane (A–D, C insert). Figure S4 shows the serial slices through the contacting extension between the mitochondrial outer membrane and the phagophore shown in panel (C). The red arrows depict membrane contacts between the phagophore and the inner ER membrane (red *) (B and C, F). Yellow arrows indicate regions of contact between the outer mitochondrial membrane and the ER (E, insert, H). White arrowheads indicate the open end of the phagophore communicating with a cluster of tubules originating from the ER (F–H). The 3D model shows one of the membrane bridges between the phagophore membrane and the outer mitochondrial membrane (D, orange arrow) as well as 2 areas of communication which exist between the ER and the phagophore (H); one from the inner ER (red *, see panel F for confirmation of contact) and 2 at the base of the phagophore (white arrowheads). One ER cisterna (red **) communicates with the mitochondrion (H, yellow arrow).