Figures & data
Figure 1. The P140 peptide disrupts HSPA8 heterocomplex assembly in vitro and alters functional HSPA8 properties. (A) Native protein extracts from P140-treated Raji cells were subjected to CoIP with anti-HSPA8 antibody 1B5. Gel staining was assessed by colloïdal blue. The arrow at ∼90 kDa (see enlargement) indicates a band that disappeared after P140 treatment. (B) Raji cells were treated with increasing concentrations of the P140 peptide or ScP140 peptide as control. Cell lysates were immunoprecipitated with anti-HSPA8 antibody 1B5 and western immunoblotting was performed for detecting HSP90AA1 and HSPA8. HSP90AA1 protein levels were normalized by densitometry to HSPA8 level using ImageJ Software. The ratios are indicated. (C) Luciferase was denatured at 40°C for 30 min and then refolded during 1 h at 30°C in rabbit reticulocyte lysate in the presence of 40 μM P140 peptide. The results (expressed in %) compare the capacity of exogenous recombinant HSPA8 (0.5 μM) or HSP90AA1 (0.5 μM) to counter-balance P140 inhibition of luciferase refolding. The values are the mean + standard deviation (SD) of 3 independent measurements. P values are indicated (Student t test). (D) Increasing concentrations of the P140 peptide were incubated for 3 h at 37°C with HSPA8 (500 nM) with or without HSP40 (500 nM), and the amount of hydrolyzed ATP was measured by luminescence detection assay. ATPase activity measured in the presence of increasing concentrations of the P140 peptide was expressed in fold induction compared to conditions in the absence of peptide. The spontaneous hydrolysis observed with the peptide alone was deduced from the values. Bars represent averaged values from 3 independent experiments + SD. (E) HSPA8 (500 nM) and HSP40 (500 nM) were incubated with 40 μM of either P140 or unphosphorylated peptide 131–151 or ScP140 peptides, and HSPA8 ATP-hydrolytic activity was assayed as described in (D). The values are the mean + SD of 6 independent experiments. The P value is indicated (Student t test).
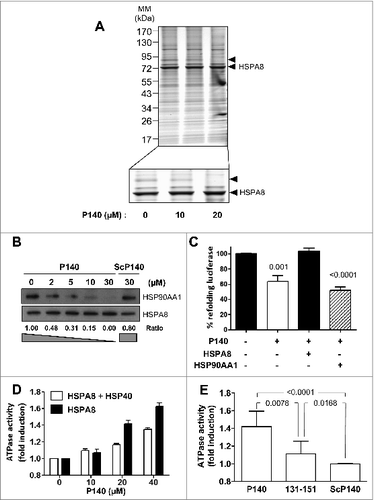
Figure 2. B cells internalize the P140 peptide by clathrin-mediated endocytosis. B cells from MRL/lpr mice were pretreated 30 min at 37°C with the following endocytosis inhibitors: chlorpromazine (CPZ) for clathrin-mediated endocytosis (A), filipin for caveolin-mediated endocytosis (B), and methyl-β-cyclodextrin for macropinocytosis (C), followed by the addition of Alexa Fluor 488-labeled P140 peptide for 30 min at 37°C. TF, bodipy, and dextran were used as respective markers of each pathway. As a control, cells were incubated at 4°C to inhibit endocytosis. For macropinocytosis analysis, unpurified splenocytes were also used since dextran was not detected into B cells. Representative results of 2 different experiments are shown.
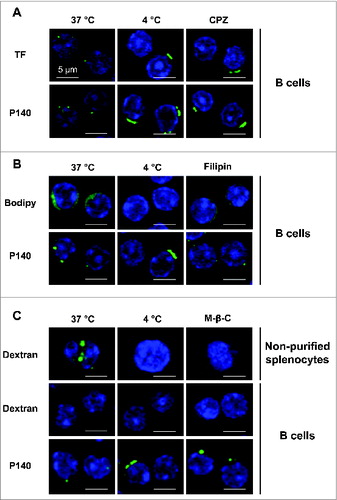
Figure 3. Colocalization of the P140 peptide with endolysosomal markers and components. (A, C, E, G) MRL/lpr mice received Alexa Fluor 488 labeled-P140 peptide (100 μg/mouse) by the iv route. Splenocytes were collected 3 h later and stained for the early endosomal marker EEA1 (A), or 6 h later and stained for the late endosomal marker RAB9 (C), lysosomal component LAMP2 (E) or LAMP2A isoform (G). Representative results of 3 independent experiments are shown. (B, D, F, H) B cells from MRL/lpr mice were incubated for 15 min (B) or 2 h (D, F, H) in the presence of Alexa Fluor 488 labeled-P140 peptide and stained for EEA1 (B), RAB9 (D) LAMP2 (F) or LAMP2A isoform (H). Representative results of 2 to 4 independent experiments are shown (2 different experimenters).
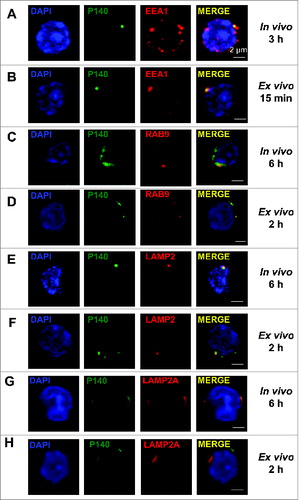
Figure 4. Effect of the P140 peptide on CMA activity on mouse fibroblasts. NIH3T3 cells stably expressing the photoactivable CMA reporter KFERQ-PA-mCherry1 were photoactivated and maintained in serum-free medium supplemented with or without (w/o) with the indicated peptides for 12 h. (A to D) Representative images, low magnification field and higher magnification single cell inserts of cells that were kept untreated (A), or treated with the P140 peptide (B), scrambled peptide ScP140 (C) or unphosphorylated peptide 131 to 151 used as control (D). Nuclei were highlighted by DAPI. (E) Quantification of the average number of fluorescent puncta per cell. Values are mean + standard error of the mean (SEM). N > 50 cells. P values are indicated (Student t test).
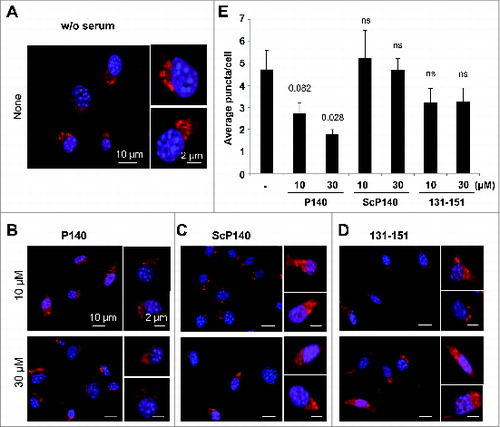
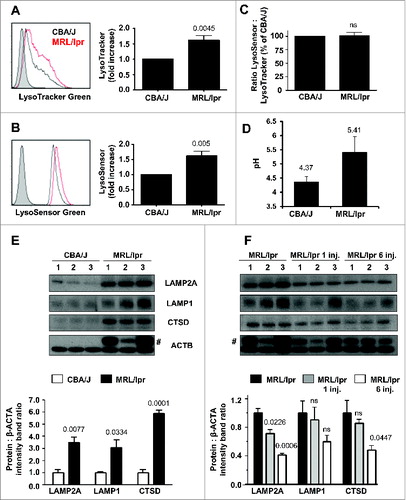
Figure 5 (See previous page). Expression of LAMP2A in MRL/lpr B cells and effect of the P140 peptide. (A to C) Splenic cells from 10–12-wk-old CBA/J and MRL/lpr mice (4 mice of each strain) were stained with LysoTracker Green, LysoSensor Green or LysoSensor Yellow/Blue and acquired by flow cytometry. Representative flow cytometry images (filled histograms, unstained cells; empty histograms, stained cells) and relative fluorescence values of LysoTracker Green (A) and LysoSensor Green (B). In (C), the ratio LysoSensor Green over LysoTracker Green fluorescence values was calculated and compared to control CBA/J mice. (D) Lysosomal pH measurement of splenocytes isolated from CBA/J and MRL/lpr mice with ratiometric dye LysoSensor Yellow/Blue DND-160. The pH values of lysosomes were calculated from the linear standard curve established in each individual assay (see Fig. S12A for this experiment). The values are the mean + SD of measurements performed in 3 mice with 3 replicates each. The error bars are the SD values of 3 replicates (the results of 3 individual mice are shown in Fig. S12C). (E, F) western immunoblotting experiments were performed for detecting the expression of LAMP2A (antibody ab18528), LAMP1 (antibody ab24170) and CTSD (antibody ab75852) in purified B cells. Comparison was made between CBA/J mice, MRL/lpr mice and P140-treated MRL/lpr mice (3 10–13 wk-old mice/group). MRL/lpr mice received 100 μg P140/mouse/injection either once (and cells were collected 5 d later) or 6 times at daily intervals, and cells were collected 1 d after the last injection. #, bands corresponding to the immunoglobulin heavy chain level visible in MRL/lpr extracts due to the presence of important amounts of remaining autoantibodies. The histograms represent the mean ratio of 3 mice + SD between band intensity corresponding to LAMP2A, LAMP1 and CTSD over β-ACTA in the different study groups tested in at least 2 independent experiments (quantification using ImageJ software). Ratios have been arbitrarily normalized to normal mice (D) or untreated MRL/lpr mice (E). P values are indicated (Student t test).