
Figures & data
Figure 1. Punctate GFP-LC3B in replicative senescent human fibroblasts. (A) Growth curves of primary WI-38 and WI-38-TERT fibroblasts in extended culture. Error bars represent standard deviation among 3 wells grown in parallel. (B) Representative images of GFP-LC3B puncta in WI-38 or WI-38-TERT cells at passage 1 and 19 after initiation of culture. A 40X objective was used for imaging. * and ** indicate significance at P < 0.05 and P < 0.01 respectively.
Figure 2. For figure legend, see page 531.
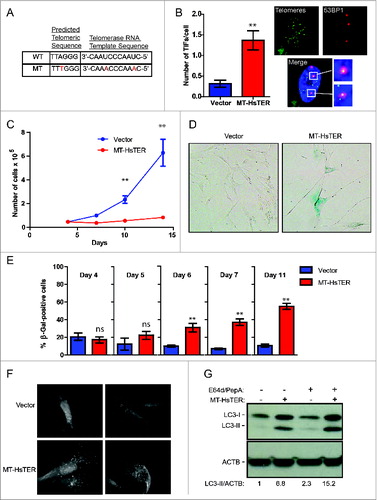
Figure 3. Autophagy inhibition does not affect the senescence transition following MT-HsTER treatment of WI-38 fibroblasts. (A) LC3B immunoblotting in WI-38-TERT fibroblasts transduced with a control, ATG5, or ATG7 shRNA and treated with 25 nM BafA1, 7 d after MT-HsTER addition. Relative amounts of LC3-II are indicated below the blots. (B) SA-β-gal staining 7 d after MT-HsTER addition. SA-β-gal staining showed a significant increase between vector and MT-HsTER cells (P < 0.05) but no significant differences were observed between the MT-HsTER-treated samples. Error bars represent standard error. (C) MKI67 staining in WI-38-TERT fibroblasts expressing a control, ATG5, or ATG7 shRNA, 7 d after MT-HsTER transduction. MT-HsTER-treated samples showed a significant depletion of MKI67-positive cells compared to controls (P < 0.05). Error bars represent standard deviation. (D) Crystal violet-stained colonies showing colony forming efficiency upon platting 3 × 10³ cells 8 d after MT-HsTER addition. Results are representative of at least 3 independent experiments.
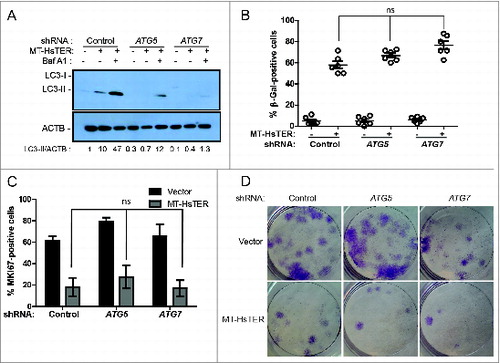
Figure 4. Autophagy inhibition does not affect the senescence transition following MT-HsTER treatment of BJ fibroblasts. (A) LC3B immunoblotting in BJ-TERT fibroblasts transduced with a control, ATG5, or ATG7 shRNA 7 d after MT-HsTER addition. Relative amounts of LC3-II are indicated below the blots. (B) SA-β-gal staining 7 d after MT-HsTER addition. SA-β-gal staining showed a significant increase between vector and MT-HsTER cells (P < 0.05) but no significant differences were observed between the MT-HsTER-treated samples. Error bars represent standard error. (C) Crystal violet-stained colonies showing colony forming efficiency upon plating 3 × 10³ cells at day 8 after MT-HsTER addition. Data is representative of at least 3 independent experiments.
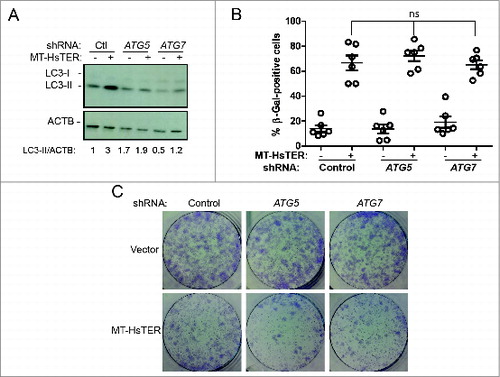
Figure 5. Senescence transition in the absence of a robust SASP in MT-HsTER-expressing BJ fibroblasts. (A) Immunoblot for HA to detect overexpressed HA-v-cyclin protein in BJ fibroblasts 7 d after transduction. (B) SA-β-gal staining during the period of senescence transition—5 and 7 d after MT-HsTER or HA-v-cyclin addition—in BJ-TERT fibroblasts. Error bars represent standard error. (C) IL6 and (D) IL8 Elisa from conditioned media harvested from BJ-TERT fibroblasts at various time points after MT-HsTER or HA-v-cyclin addition. Error bars represent standard deviation. Elisa data includes 2 independent experiments. SA-β-Gal data is representative of at least 3 independent experiments. ** indicates significance at P < 0.01 when compared to the vector control.
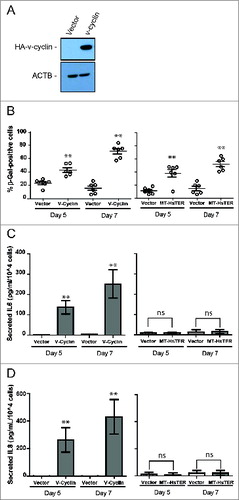
Figure 6. For figure legend, see page 535.
Table 1. Primers used for quantitative RT-PCR analysis