Figures & data
Figure 1. Stxs destroy the intestinal mucosal tissue, and induce cell death in human colorectal cancer cells. (A) Representative images of hematoxylin and eosin staining of colonic epithelium from surgery patients. The colon intestinal tissue challenged by the sonicated lysate of the ΔStx1 and ΔStx2 strains versus WT or the control for 24 h. Scale bar in all panels: 50 μm. (B) The effect of Stx1 and Stx2 on the viability of human colorectal cancer cells. Caco-2 cells were treated with the indicated treatments of the sonicated lysate (the concentration of toxin was about 30 ng/ml) of WT, ΔStx1, ΔStx2, and the control for 24 h, which can eliminate interference induced by cell culture medium acidification and hypoxia during live bacterial infection. Cell viability was assessed using an MTT assay. (C) To assess cell death in vitro, Caco-2 cells were treated with the sonicated lysate (the concentration of toxin was about 30 ng/ml) of the indicated bacteria for 24 h; the cells were then subjected to ANXA5-PI staining and analyzed by flow cytometry. The percentage of cells that were PI-positive relative to the total cell number for each treatment is shown. The data are presented as the mean ± SD of 3 independent experiments. * P < 0.05.
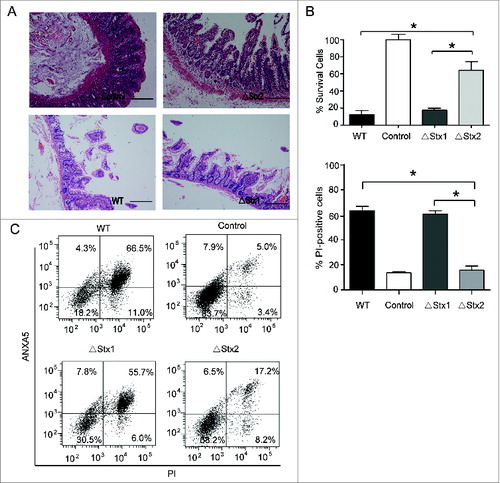
Figure 2. Cell death caused by Stx2 is dependent on autophagy. (A and B) Stx2 induced cell death in Caco-2 cells. The cells were treated with Stx2 (30 ng/ml) for 1, 2 or 4 h. (C and D) The effects of 3-MA or Z-VAD on the cytotoxicity of Stx2 in Caco-2 cells. After pretreatment with 2 mM 3-MA or 50 μM Z-VAD, Caco-2 cells were treated with 30 ng/ml Stx2 for 4 h. The percentage of dead cells was determined using the cell death assay (PI staining) or the cell viability assay (MTT). The results shown are representative of at least 3 independent experiments.*P < 0.05, **P < 0.01.
Figure 3. Stx2 induces autophagy in Caco-2 cells. (A and B) Caco-2 cells were subjected to the indicated treatments for 4 h and were stained with 1 mg/ml acridine orange or 50 mM MDC for 15 min. After incubation, the cells were immediately analyzed by flow cytometry. (C) Measurement of the MAP1LC3B-II conversion in Caco-2 cells subjected to the indicated treatments using western blot analysis. (D and E) Stx2 increased the conversion of MAP1LC3B-I to MAP1LC3B-II in Caco-2 cells. Caco-2 cells were treated with a gradually increasing concentration of Stx2 (0, 10, 20, 30, or 40 ng/ml) or were treated with 30 ng/ml Stx2 for 1, 2, 4, 8, 12, or 24 h. (F) Stx2 induced incomplete autophagic flux in Caco-2 cells. Caco-2 cells were treated with 30 ng/ml Stx2 for 4 h in the presence of 10 nM Baf A1. (G) Caco-2 cells were transfected with a plasmid expressing GFP-MAP1LC3B. After 24 h, the cells were treated with 30 ng/ml Stx2 for 4 h. Following fixation the cells were immediately visualized using a confocal microscope. The number of GFP-MAP1LC3B puncta in each cell was counted. (H) Representative TEM images of Caco-2 cells treated with 30 ng/ml Stx2 treatment for 4 h. The arrows indicate the autophagosomes. The experiments were performed in triplicate, and all replicates showed similar results.*P < 0.05.
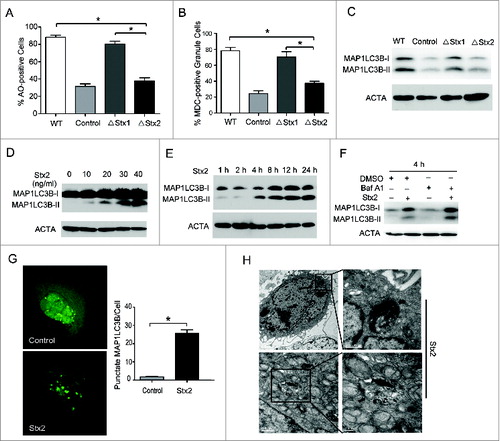
Figure 4. ER stress may be involved in Stx2-induced cell death. (A) High-resolution TEM images of Caco-2 cells treated with 30 ng/ml Stx2 for 4 h. The TEM images showed the dilatation of the ER in the Stx2-treated cells compared to the untreated cells. (B) Measurement of MAP1LC3B-II conversion in Caco-2 cells using western blot analysis. The cells were treated with 30 ng/ml Stx2 for 4 h in the presence of 200 nM thapsigargin (Thap). (C and D) Caco-2 cells were exposed to 200 nM Thap, a combination of 200 nM Thap and 30 ng/ml Stx2, or Stx2 alone for 4 h. The cells that were positive for autophagosomes were detected using an acridine orange staining assay. Cell death was analyzed following PI staining. *P < 0.05.
Figure 5. Stx2 induces autophagy through ER stress. (A) Measurement of EIF2S1 phosphorylation and MAP1LC3B-II conversion following Stx2 treatment using western blot analysis. Caco-2 cells were treated with 30 ng/ml Stx2 for 0, 1, 2, 4, or 8 h or were untreated for 8 h. (B) The inhibition efficiency of the siRNAs against DDIT3 and ATF4. Caco-2 cells were transfected with siRNAs targeting DDIT3 and ATF4 (100 nM each) for 24 h, and the protein levels of the 2 targets were evaluated using western blot analysis. (C and D) The quantification of autophagosomes in Caco-2 cells by acridine orange staining. The cells were treated with only 30 ng/ml Stx2 or were treated with Stx2 after transfection with siC, siDDIT3, or siATF4 for 24 h. (E and F) Detection of cell death by PI staining. Caco-2 cells were treated as above. The data shown represent the mean ±SD of at least 3 independent experiments.*P < 0.05.
Figure 6. Stx2-induced autophagy is dependent on the ER. (A) Detection of the inhibition efficiency of siRNAs against NUPR1 and TRIB3. Caco-2 cells were transfected with siRNAs targeting NUPR1 and TRIB3 (100 nM each) for 24 h, and the protein levels of the 2 targets were evaluated using western blot analysis. (B) The effect of 30 ng/ml Stx2 on MAP1LC3B-II conversion in Caco-2 cells transfected with siC, siNUPR1, or siTRIB3 for 24 h. (C and D) Detection of MDC and AO staining of cells that were transfected with siC, siNUPR1, or siTRIB3 using flow cytometry analysis. The experiments performed in triplicate showed consistent results. * P < 0.05.
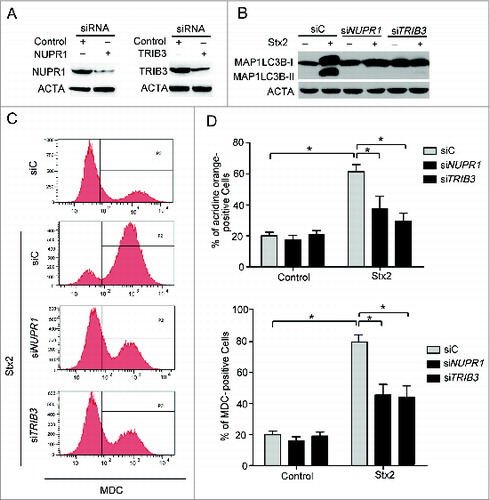
Figure 7. Autophagy is upstream of apoptosis in Stx2-induced cell death. (A) Detection of active CASP3 following 3-MA pretreatment in cells. (B) Measurement of MAP1LC3B-II conversion following Stx2 treatment using western blot analysis. Caco-2 cells were treated with 30 ng/ml Stx2 for 4 h in the presence of 2 mM 3-MA. (C) Detection of AO staining by flow cytometry following Stx2 treatment. Caco-2 cells were treated as above. (D) The inhibition efficiency of siRNAs against ATG12 and BECN1. Caco-2 cells were transfected with siRNAs targeting ATG12 and BECN1 (100 nM each) for 24 h, and the protein levels of the 2 targets were evaluated using western blot analysis. (E) The effect of 30 ng/ml Stx2 on PARP1 cleavage in Caco-2 cells transfected with siC, siATG12, or siBECN1. (F) Detection of cell death by flow cytometry in cells transfected with siC, siATG12, or siBECN1 for 24 h. (G and H) Detection of MDC and AO staining of cells treated with Z-VAD or 30 ng/ml Stx2 using flow cytometry analysis. (I) The MAP1LC3B-II conversion was detected using western blot analysis. Caco-2 cells were treated as above. (J) Caco-2cells were treated with 30 ng/ml Stx2 for the indicated times. The cell lysates were prepared for western blot analysis to detect the phosphorylation of AKT1, MTOR, MAPK, and the expression of BECN1 using the indicated antibodies.
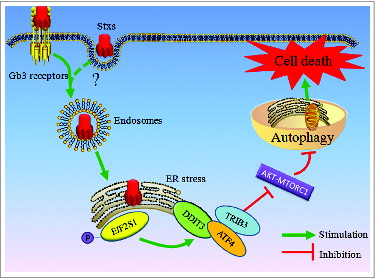
Figure 8. Schematic of the proposed mechanism of Shiga toxins inducing autophagic cell death in intestinal epithelial cells via the endoplasmic reticulum stress pathway (see text for details).