Figures & data
Figure 1. CSF1-induced differentiation of human monocytes is associated with the induction of PRKAA expression and activation. Human peripheral blood monocytes from healthy donors were exposed to 100 ng/mL CSF1 for the indicated times. (A) Macrophage differentiation was examined morphologically (fibroblastic shape) and by 2-color flow cytometric analysis. The percentage indicates cells that express both TFRC/CD71 and CD163. (B) Immunoblot analysis of PRKAA and phospho-PRKAA (Thr172) in monocytes following CSF1 stimulation. The ratio between phospho-PRKAA protein and ACTB was determined from 3 independent experiments using the ImageJ software. (C) The ratio of the PRKAA to phospho-PRKAA protein level was determined from the results of using the ImageJ software. (D) Real-time qPCR analysis of PRKAA1 gene expression in monocytes exposed to 100 ng/mL CSF1 for the indicated times (mean ± SD of 3 independent experiments). (E) Immunoblot analysis of PRKAA1 and phospho-PRKAA1 (Thr172) in monocytes exposed to 100 ng/mL CSF1 alone or in association with 10 μg/mL cycloheximide (CHX), which was added 45 min before CSF1 treatment. ACTB was detected as the loading control. Each panel is representative of at least 3 independent experiments.
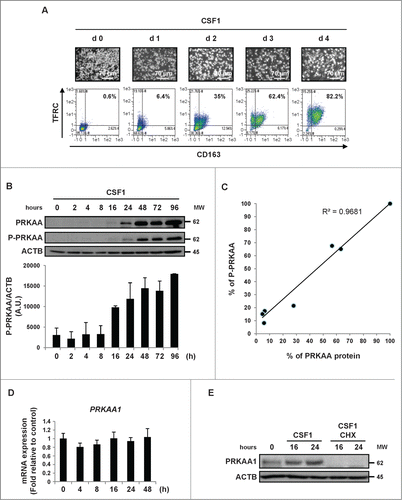
Figure 2. PRKAA1 is required for macrophagic differentiation of monocytes. (A) Human monocytes were exposed for 2 d to 100 ng/mL CSF1 alone or in combination with 2 μM DRS, which was added 45 min before CSF1 treatment. The expression of PRKAA1, Phospho-PRKAA1 and Phospho-PRKAA substrates was analyzed by immunoblotting. (B) Human monocytes were exposed for 2 d to 100 ng/mL CSF1 alone or in combination with 2 μM DRS, which was added 45 min before CSF1 treatment. Differentiation was measured as described in . (C) Monocytes were transfected with siRNAs targeting LUCIFERASE (LUC) or PRKAA1 and exposed 2 d to 100 ng/mL CSF1. The expression of PRKAA1, Phospho-PRKAA1 and Phospho-PRKAA substrates was analyzed by immunoblotting. (D) Monocytes were transfected with siRNA targeting LUCIFERASE (LUC) or PRKAA1 and exposed for 2 d to CSF1. Differentiation was assessed as described in . (E) Enriched bone marrow murine monocytes were exposed for the indicated time to 100 ng/mL CSF1. Differentiation was studied by morphological examination (fibroblastic shape) and by 2-color flow cytometry analysis at indicated day. Percentages indicate cells that express both high ITGAM/CD11b and EMR1/F4/80 staining. (F) Immunoblot analysis of PRKAA1 and phospho-PRKAA1 (Thr172) in monocytes following CSF1 stimulation. (G) Immunoblot analysis of PRKAG1/AMPKγ1 and PRKAA1 in monocytes obtained from WT or prkag1−/- mice (n = 2). ACTB was detected as a loading control. (H) Monocytes obtained from WT or prkag1−/- mice were exposed for the indicated times to 100 ng/mL CSF1. Differentiation was assessed as described in . For each experiment, ACTB was detected as the loading control. Each panel is representative of at least 3 independent experiments.
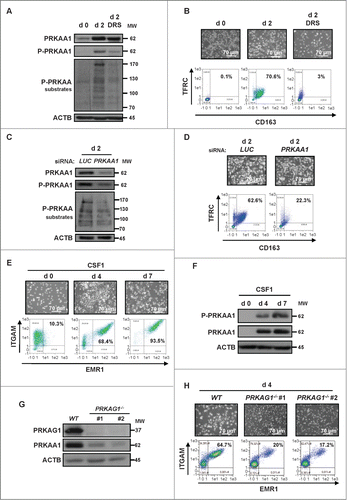
Figure 3. The CAMKK2-PRKAA1 axis is required for human monocyte differentiation. (A) Human monocytes were exposed for 2 d to 100 ng/mL CSF1 alone or in combination with 2 μM DRS or 10 μM STO-609, which were added 45 min before CSF1 treatment. The expression of PRKAA1, Phospho-PRKAA1 and Phospho-PRKAA substrates was analyzed by immunoblotting. (B) Human monocytes were exposed for 2 d to 100 ng/mL CSF1 alone or in combination with either 2 μM DRS or 10 μM STO-609, which were added 45 min before CSF1 treatment. Differentiation was examined as described in . (C) Monocytes were transfected with siRNA targeting LUCIFERASE (LUC), CAMKK2 or PRKAA1 and exposed for 2 d to 100 ng/mL CSF1. Expression of CAMKK2, PRKAA1, and Phospho-PRKAA1 was analyzed by immunoblotting. (D) Monocytes were transfected with siRNA and treated as in . Differentiation was examined as previously described. (E) Functional assay of monocytes exposed for 2 d to 100 ng/mL CSF1 alone or in combination with 2 μM DRS or 10 μM STO-609. The results are expressed as the number of phagocytosed bacteria per cell and represent the mean ± SD of 4 independent experiments performed in triplicate. *P < 0.05 and **P < 0.01 (vs. untreated cells) according to a Student paired t test. (F) Functional assay of monocytes transfected with LUCIFERASE (LUC), CAMKK2, or PRKAA1 siRNA and treated for 2 d with CSF1. The results are expressed as in **P < 0.01 and **P < 0.001 (vs d2 siLUC) according to a paired Student t test. Each panel is representative of at least 3 independent experiments.
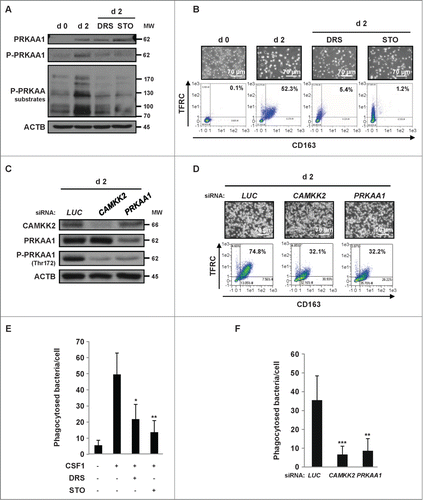
Figure 4. PLCG2 downstream of the CSF1 receptor is involved in monocyte differentiation but not in PRKAA1 activation. (A) Monocytes were loaded using the Fluo-4 Direct Calcium Assay kit and stimulated with 100 ng/mL CSF1 alone or in combination with one μM U73122. Calcium fluxes are expressed as the median of the fluorescence Intensity (MFI, arbitrary unit) and represent the mean ± SD of 3 independent experiments performed in duplicate. (B) Human monocytes were exposed for one d to 100 ng/mL CSF1 alone or in combination with either 10 μM STO-609 or 1 μM U73122, which were added 45 min before CSF1 treatment. The expression of Phospho-PLCG2, PRKAA1, Phospho-PRKAA1 and Phospho-PRKAA substrates was analyzed by immunoblotting. (C) Monocytes were transfected with siRNAs targeting LUCIFERASE (LUC), CSF1R or PLCG2 and exposed for one d to 100 ng/ml CSF1. The expression of the different proteins was analyzed by immunoblotting. (D and E) Monocytes were transfected with siRNAs targeting LUCIFERASE (LUC), or PLCG2 and exposed for 2 d to 100 ng/ml CSF1. The expression of PLCG2 was analyzed by immunoblotting (D), and differentiation was evaluated as described previously (E). Each panel is representative of at least 3 independent experiments.
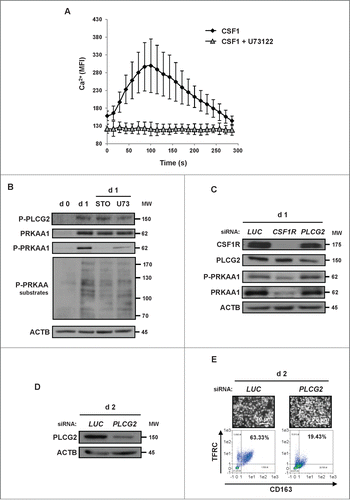
Figure 5. For figure legend, see page 1122. Figure 5 (See previous page). P2RY6 engagement activates a PLCB3-CAMKK2-PRKAA1 pathway that promotes human monocyte differentiation. (A) Human monocytes were exposed for one d to 100 ng/mL CSF1 or 100 μM UDP alone or in combination with either 10 μM STO-609 or MRS2578 (3 or 5 μM), which were added 45 min before CSF1 treatment. The expression of PRKAA1 and Phospho-PRKAA1 was analyzed by immunoblotting. (B and C) Human monocytes were exposed for 2 d to 100 ng/mL CSF1 alone or in combination with 5 μM MRS2578, which was added 45 min before CSF1 treatment. (B) Differentiation was examined as described previously. Percentages indicate cells that express both TFRC/CD11b and CD163. (C) Functional assay of monocytes exposed for 2 d to 100 ng/mL CSF1 alone or in combination with 5 μM MRS2578. The results are expressed as the number of phagocytosed bacteria per cell and represent the mean ± SD of 4 independent experiments performed in triplicate. ***P < 0.001 (vs CSF1 treated cells) according to a paired Student t test. (D and E) Monocytes were transfected with siRNA targeting LUCIFERASE (LUC), P2RY6 or PLCB3 and exposed for one d to 100 ng/mL CSF1. (D) The expression of PLCB3, Phospho-PRKAA1 and PRKAA1 was analyzed by immunoblotting. The ratio between phospho-PRKAA1 protein and ACTB was determined from 3 independent experiments using the ImageJ software. *P < 0.05 (vs d1 LUC) according to a paired Student t test. (E) The expression of P2RY6 in transfected monocytes was analyzed by immunofluorescence and flow cytometry after one d of treatment with 100 ng/mL CSF1. Two representative pictures are shown (nuclear staining in blue and P2RY6 in green, left panel). The results are expressed as the fold induction compared to LUC siRNA and represent the mean ± SD of 3 independent experiments performed in duplicate (Right panel). **P < 0.01 (vs d2 siLUC) according to a paired Student t test. (F) Monocytes were transfected with siRNAs targeting LUCIFERASE (LUC), P2RY6 or PLCB3 and exposed for 2 d to 100 ng/mL CSF1. Differentiation was examined as previously described. Each panel is representative of at least 3 independent experiments.
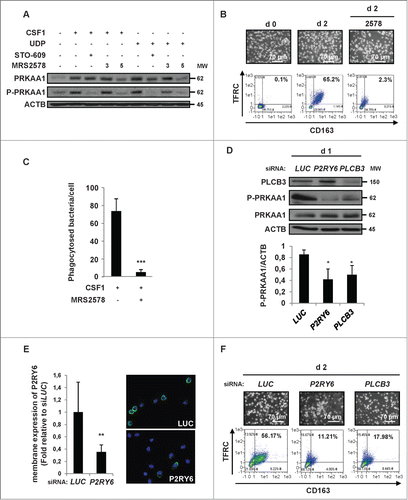
Figure 6. For figure legend, see page 1124. Figure 6 (See previous page). The P2RY6-PRKAA1 pathway mediates autophagy induction and monocyte differentiation. (A–C) Human monocytes were exposed for 2 d to 100 ng/mL CSF1 alone or in combination with 2 μM DRS, which was added 45 min before CSF1 treatment. (A) Differentiation was visualized as described previously. (B) The autolysosome number was quantified by flow cytometric analysis using a Cyto-ID® Autophagy Detection Kit. A representative cytometry profile is shown in the upper panel. The results are expressed as the fold induction compared with untreated cells and represent the mean ± SD of 3 independent experiments performed in duplicate (lower panel). ***P < 0.001 (vs untreated cells) according to a paired Student t test. (C) Immunoblot analysis of the indicated protein is shown. (D and E) Monocytes were transfected with siRNA targeting LUCIFERASE (LUC) or PRKAA1 and exposed for 2 d to CSF1. (D) Differentiation was examined as described in . Autolysosomes were quantified by flow cytometric analysis using the Cyto-ID® Autophagy Detection Kit. A representative cytometry profile is shown (right panel). (E) The expression of PRKAA1, Phospho-PRKAA1, Phospho-ULK1, ULK1 and LC3B was analyzed by immunoblotting. (F) Monocytes were transfected with siRNA targeting LUCIFERASE (LUC) or PRKAA1 and exposed for 2 d to 100 ng/mL CSF1 alone or in association with 15 nM bafilomycin A1 (BafA1) added 3 h before the end of CSF1 treatment and protein expression was analyzed by immunoblot. The ratio between LC3B-II protein and ACTB was determined using the ImageJ software. For all western blot experiments, ACTB was detected as the loading control. Each panel is representative of at least 3 independent experiments.
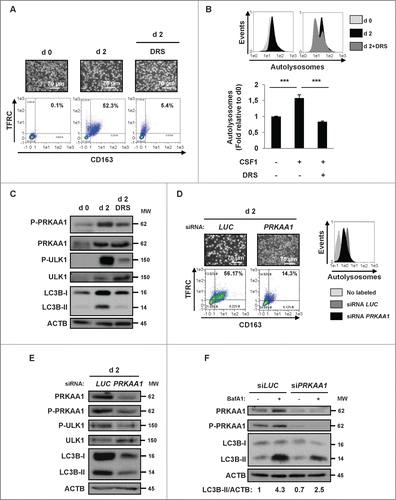
Figure 7. Differentiation defect in CMML patients can be restored by UDP and P2RY6 agonists through PRKAA1 reactivation. (A–C) Following negative sorting, CD14+ and CD24− (monocytes), as well as CD14− and CD24+ (immature granulocytes) populations from one CMML patient were cultured separately or together with CSF1 alone or in the presence of 100 μM UDP or 30 μM MRS2693 for the indicated times. (A) Flow cytometric analysis of CD14 and CD24, identifying CD14+ and CD24−, as well as CD14− and CD24+ cells in the CMML patient. Differentiation was only examined for CD14+ cells. (B) CD14+ and CD24− (monocytes), as well as CD14− and CD24+ (immature granulocytes) populations were cultured together with CSF1 alone or in the presence of 100 μM UDP or MRS2693 (10 or 30 μM) for the indicated times. The expression of PRKAA1, Phospho-PRKAA1, and LC3B was analyzed by immunoblotting. ACTB was detected as a loading control. (C) The ratio of the phospho-PRKAA1 protein level to that of ACTB protein level was measured from the protein band signals of , using the ImageJ software.
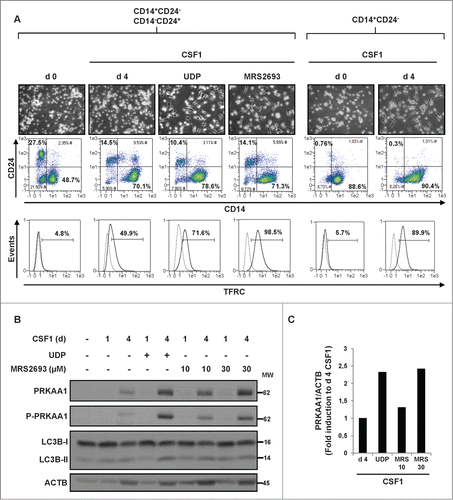
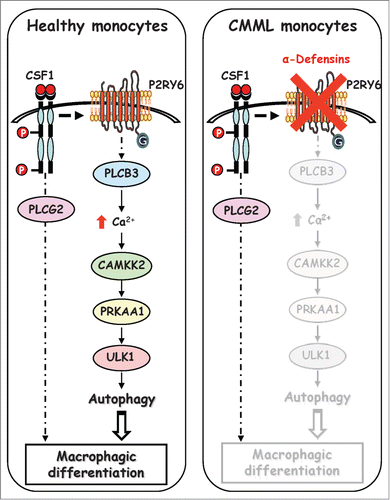
Figure 8. Schematic view of the signaling pathways involved in healthy and CMML monocytes during CSF1-induced differentiation. Upon CSF1 binding, the CSF1R triggers the activation of the P2RY6-PLCB3-CAMKK2-PRKAA1-ULK1 pathway leading to induction of autophagy and human monocyte differentiation. In a CMML-dependent context, immature dysplastic granulocytes synthesize and secrete large amounts of α-defensins DEFA1 and DEFA3, which antagonize P2RY6 and inhibit CSF1-induced differentiation of monocytes.