6,173
Views
140
CrossRef citations to date
0
Altmetric
Basic Research Papers

Tomato HsfA1a plays a critical role in plant drought tolerance by activating ATG genes and inducing autophagy

, , , , , , & show all
Pages 2033-2047 | Received 06 May 2015, Accepted 16 Sep 2015, Published online: 09 Dec 2015

Figures & data

Figure 1. Functional analysis of HsfA1a in response to drought stress in tomato leaves. (A) The expression of HsfA1a in the WT plants under drought stress. Six-wk-old tomato WT Ailsa Craig plants were exposed to dehydration by withholding water. Total RNA was isolated from leaf samples of the WT plants at the indicated times. (B and C) Reduced or increased tomato drought tolerance in TRV-HsfA1a or HsfA1aOE plants. Six-wk-old plants in soils were exposed to dehydration by withholding water for 13 d. Bars: 10 cm. (D) Relative water content (RWC) of the terminal leaflets were determined immediately after 13 d of control or drought treatment in TRV and TRV-HsfA1a plants or WT and HsfA1aOE plants. All data are presented as the means of 5 biological replicates (± SE). Means with the same letter did not significantly differ at P< 0.05 according to Duncan multiple range test. Three independent experiments were performed with similar results. 1# and 3#, 2 lines of HsfA1aOE plants; OE, overexpressing; WT, wild-type.
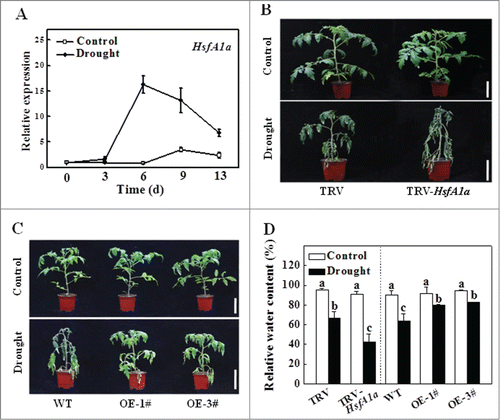
Figure 1. Functional analysis of HsfA1a in response to drought stress in tomato leaves. (A) The expression of HsfA1a in the WT plants under drought stress. Six-wk-old tomato WT Ailsa Craig plants were exposed to dehydration by withholding water. Total RNA was isolated from leaf samples of the WT plants at the indicated times. (B and C) Reduced or increased tomato drought tolerance in TRV-HsfA1a or HsfA1aOE plants. Six-wk-old plants in soils were exposed to dehydration by withholding water for 13 d. Bars: 10 cm. (D) Relative water content (RWC) of the terminal leaflets were determined immediately after 13 d of control or drought treatment in TRV and TRV-HsfA1a plants or WT and HsfA1aOE plants. All data are presented as the means of 5 biological replicates (± SE). Means with the same letter did not significantly differ at P< 0.05 according to Duncan multiple range test. Three independent experiments were performed with similar results. 1# and 3#, 2 lines of HsfA1aOE plants; OE, overexpressing; WT, wild-type.

Figure 2. Stomatal aperture and ABA content in TRV-HsfA1a and HsfA1aOE plants after 6 d under drought stress. (A) Microphotographs of stomata observed in TRV and TRV-HsfA1a plants under drought stress. Bars: 10 µm. (B) Ratio of stomatal aperture length over width were plotted for the TRV and TRV-HsfA1a plants under drought stress. The data are presented as the means of 5 biological replicates (± SE); each replicate represents the average stomatal aperture of 150 randomly selected stomata. (C) Accumulation of ABA in TRV and TRV-HsfA1a plants under drought stress. (D) Microphotographs of stomata observed in WT and HsfA1aOE plants under drought stress. Bars: 10 µm. (E) Ratio of stomatal aperture length over width were plotted for the WT and HsfA1aOE plants under drought stress. The data are presented as the means of 5 biological replicates (± SE); each replicate represents the average stomatal aperture of 150 randomly selected stomata. (F) Accumulation of ABA in WT and HsfA1aOE plants under drought stress. The data are presented as the means of 5 biological replicates (± SE). Means with the same letter did not significantly differ at P< 0.05 according to the Duncan multiple range test. Three independent experiments were performed with similar results. OE, overexpressing; WT, wild-type.
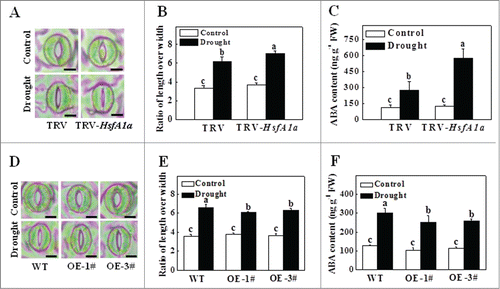
Figure 2. Stomatal aperture and ABA content in TRV-HsfA1a and HsfA1aOE plants after 6 d under drought stress. (A) Microphotographs of stomata observed in TRV and TRV-HsfA1a plants under drought stress. Bars: 10 µm. (B) Ratio of stomatal aperture length over width were plotted for the TRV and TRV-HsfA1a plants under drought stress. The data are presented as the means of 5 biological replicates (± SE); each replicate represents the average stomatal aperture of 150 randomly selected stomata. (C) Accumulation of ABA in TRV and TRV-HsfA1a plants under drought stress. (D) Microphotographs of stomata observed in WT and HsfA1aOE plants under drought stress. Bars: 10 µm. (E) Ratio of stomatal aperture length over width were plotted for the WT and HsfA1aOE plants under drought stress. The data are presented as the means of 5 biological replicates (± SE); each replicate represents the average stomatal aperture of 150 randomly selected stomata. (F) Accumulation of ABA in WT and HsfA1aOE plants under drought stress. The data are presented as the means of 5 biological replicates (± SE). Means with the same letter did not significantly differ at P< 0.05 according to the Duncan multiple range test. Three independent experiments were performed with similar results. OE, overexpressing; WT, wild-type.

Figure 3. Accumulation and ubiquitination of insoluble proteins in TRV, TRV-HsfA1a, WT and HsfA1aOE plants under drought stress. (A) Accumulation of insoluble proteins in TRV and TRV-HsfA1a plants under drought stress. Leaf tissues from TRV and TRV-HsfA1a plants collected at d 13 under drought stress for the preparation of total, soluble and insoluble proteins as described in the Materials and Methods. Total proteins in the starting homogenates and insoluble proteins in the last pellets were determined for the calculation of the percentages of insoluble proteins to total proteins. The data are presented as the means of 5 biological replicates (± SE). Means with the same letter did not significantly differ at P< 0.05 according to the Duncan multiple range test. (B) Ubiquitination of insoluble protein aggregates in TRV and TRV-HsfA1a plants collected at day 13 under drought stress. Proteins from the starting homogenates (T), first supernatant fractions (S) and last pellet fractions (P) were subjected to SDS-PAGE and probed with an anti-ubiquitin monoclonal antibody. Three independent experiments were performed with similar results. (C) Accumulation of insoluble proteins in WT and HsfA1aOE plants under drought stress. Leaf tissues from WT and HsfA1aOE plants collected at d 13 under drought stress for the preparation of total, soluble and insoluble proteins as described in Materials and Methods. Total proteins in the starting homogenates and insoluble proteins in the last pellets were determined for the calculation of the percentages of insoluble proteins to total proteins. The data are presented as the means of 5 biological replicates (± SE). Means with the same letter did not significantly differ at P < 0.05 according to the Duncan multiple range test. (D) Ubiquitination of insoluble protein aggregates in WT and HsfA1aOE plants collected at day 13 under drought stress. Proteins from the starting homogenates (T), first supernatant fractions (S) and last pellet fractions (P) were subjected to SDS-PAGE and probed with an anti-ubiquitin monoclonal antibody. Three independent experiments were performed with similar results.
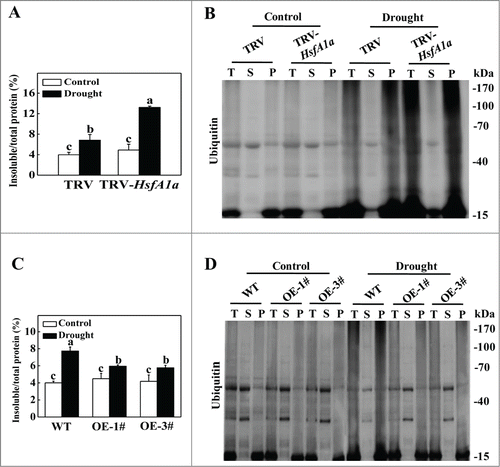
Figure 3. Accumulation and ubiquitination of insoluble proteins in TRV, TRV-HsfA1a, WT and HsfA1aOE plants under drought stress. (A) Accumulation of insoluble proteins in TRV and TRV-HsfA1a plants under drought stress. Leaf tissues from TRV and TRV-HsfA1a plants collected at d 13 under drought stress for the preparation of total, soluble and insoluble proteins as described in the Materials and Methods. Total proteins in the starting homogenates and insoluble proteins in the last pellets were determined for the calculation of the percentages of insoluble proteins to total proteins. The data are presented as the means of 5 biological replicates (± SE). Means with the same letter did not significantly differ at P< 0.05 according to the Duncan multiple range test. (B) Ubiquitination of insoluble protein aggregates in TRV and TRV-HsfA1a plants collected at day 13 under drought stress. Proteins from the starting homogenates (T), first supernatant fractions (S) and last pellet fractions (P) were subjected to SDS-PAGE and probed with an anti-ubiquitin monoclonal antibody. Three independent experiments were performed with similar results. (C) Accumulation of insoluble proteins in WT and HsfA1aOE plants under drought stress. Leaf tissues from WT and HsfA1aOE plants collected at d 13 under drought stress for the preparation of total, soluble and insoluble proteins as described in Materials and Methods. Total proteins in the starting homogenates and insoluble proteins in the last pellets were determined for the calculation of the percentages of insoluble proteins to total proteins. The data are presented as the means of 5 biological replicates (± SE). Means with the same letter did not significantly differ at P < 0.05 according to the Duncan multiple range test. (D) Ubiquitination of insoluble protein aggregates in WT and HsfA1aOE plants collected at day 13 under drought stress. Proteins from the starting homogenates (T), first supernatant fractions (S) and last pellet fractions (P) were subjected to SDS-PAGE and probed with an anti-ubiquitin monoclonal antibody. Three independent experiments were performed with similar results.

Figure 4. Induction of autophagy genes by drought stress in TRV, TRV-HsfA1a, WT and HsfA1aOE plants. Six-wk-old tomato plants were exposed to dehydration by withholding water and total RNA was isolated from leaf samples collected on d 6. Transcript levels were determined using qRT-PCR. All data are presented as the means of 5 biological replicates (± SE). Means with the same letter did not significantly differ at P< 0.05 according to the Duncan multiple range test. Three independent experiments were performed with similar results.
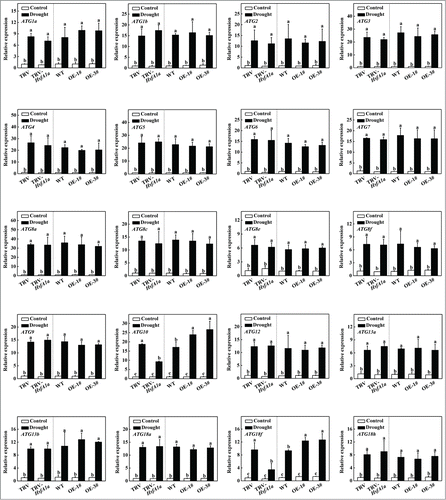
Figure 4. Induction of autophagy genes by drought stress in TRV, TRV-HsfA1a, WT and HsfA1aOE plants. Six-wk-old tomato plants were exposed to dehydration by withholding water and total RNA was isolated from leaf samples collected on d 6. Transcript levels were determined using qRT-PCR. All data are presented as the means of 5 biological replicates (± SE). Means with the same letter did not significantly differ at P< 0.05 according to the Duncan multiple range test. Three independent experiments were performed with similar results.

Figure 5. Visualization of the accumulation of autophagosomes in tomato leaves under drought stress. (A and B) MDC-stained autophagosomes in the leaves of TRV and TRV-HsfA1a or WT and HsfA1aOE plants. Six-wk-old plants were exposed to dehydration by withholding water and the leaves were MDC-stained and visualized on day 6 by fluorescence confocal microscopy. MDC-labeled structures are shown as green signals. Bars: 25 μm. (C) Relative autophagic activity normalized to the activity of the TRV or WT control plants in (A and B). The MDC-stained autophagosomes in leaves at each treatment were quantified to calculate the autophagic activity relative to TRV or WT control plants, which was set to 1. More than 300 mesophyll cells for each treatment were used for the quantification. (D and E) Representative transmission electron microscopy (TEM) images of autophagic structures in the mesophyll cells of TRV and TRV-HsfA1a or WT and HsfA1aOE plants. Six-wk-old plants were exposed to dehydration by withholding water and the mesophyll cells were visualized on d 6 by TEM. Autophagic bodies are indicated by red arrows. Bars: 1 µm. (F) Relative autophagic activity normalized to the activity of the TRV or WT control plants in (D and E). More than 20 cells were used to quantify autophagic structures. (G and H) Atg8 protein levels in the leaves of TRV and TRV-HsfA1a plants or WT and HsfA1aOE plants. Atg8 and Atg8–PE are the nonlipidated and lipidated forms of Atg8, respectively. The Rubisco large subunit was used as a loading control for the western blotting analysis. Results represent the means ± SE. Means with the same letter did not significantly differ at P< 0.05 according to the Duncan multiple range test. Three independent experiments were performed with similar results. Cp, chloroplast; V, vacuole; S, starch; OE, overexpressing; WT, wild-type; 1# and 3#, 2 lines of HsfA1aOE plants.
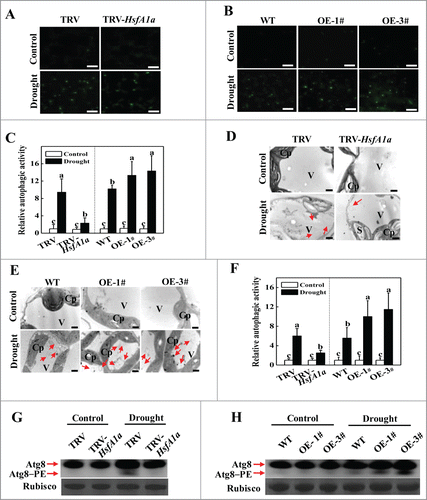
Figure 5. Visualization of the accumulation of autophagosomes in tomato leaves under drought stress. (A and B) MDC-stained autophagosomes in the leaves of TRV and TRV-HsfA1a or WT and HsfA1aOE plants. Six-wk-old plants were exposed to dehydration by withholding water and the leaves were MDC-stained and visualized on day 6 by fluorescence confocal microscopy. MDC-labeled structures are shown as green signals. Bars: 25 μm. (C) Relative autophagic activity normalized to the activity of the TRV or WT control plants in (A and B). The MDC-stained autophagosomes in leaves at each treatment were quantified to calculate the autophagic activity relative to TRV or WT control plants, which was set to 1. More than 300 mesophyll cells for each treatment were used for the quantification. (D and E) Representative transmission electron microscopy (TEM) images of autophagic structures in the mesophyll cells of TRV and TRV-HsfA1a or WT and HsfA1aOE plants. Six-wk-old plants were exposed to dehydration by withholding water and the mesophyll cells were visualized on d 6 by TEM. Autophagic bodies are indicated by red arrows. Bars: 1 µm. (F) Relative autophagic activity normalized to the activity of the TRV or WT control plants in (D and E). More than 20 cells were used to quantify autophagic structures. (G and H) Atg8 protein levels in the leaves of TRV and TRV-HsfA1a plants or WT and HsfA1aOE plants. Atg8 and Atg8–PE are the nonlipidated and lipidated forms of Atg8, respectively. The Rubisco large subunit was used as a loading control for the western blotting analysis. Results represent the means ± SE. Means with the same letter did not significantly differ at P< 0.05 according to the Duncan multiple range test. Three independent experiments were performed with similar results. Cp, chloroplast; V, vacuole; S, starch; OE, overexpressing; WT, wild-type; 1# and 3#, 2 lines of HsfA1aOE plants.

Figure 6. HsfA1a binds to the promoters of ATG10 and ATG18f in vitro and in vivo. (A) Oligonucleotide used in the electrophoretic mobility shift assays (EMSA). The ATG10 probe contains one direct HSE, whereas in the ATG10−1Δ and ATG10–2Δ probes the HSE core sequence was mutated. The ATG18f probe contains one direct HSE, whereas in the ATG18fΔ probe, the HSE core sequence was mutated. The WT and mutated HSE sequences are underlined. The mutated bases were indicated in red. (B and C) EMSA showing HsfA1a bound to the HSE sequences of the ATG10 or ATG18f promoters. Recombinant HsfA1a was purified from E. coli cells and used for DNA binding assays with ATG10, ATG10−1Δ, ATG10–2Δ, ATG18f, or ATG18fΔ as the probes. His was included as the negative control. (D) Direct binding of HsfA1a to the ATG10 and ATG18f promoters was analyzed using ChIP-qPCR in 35S-HsfA1a-HA-overexpressing (HsfA1aOE) plants. Six-wk-old HsfA1aOE plants were exposed to dehydration by withholding water and input chromatin was isolated from leaf samples on d 6. The epitope-tagged HsfA1a-chromatin complex was immunoprecipitated with an anti-HA antibody. A control reaction was processed side-by-side using mouse IgG. Input- and ChIP-DNA samples were quantified by qRT-PCR using primers specific for the promoters of the ATG genes. The ChIP results are presented as percentage of the input DNA. Means with the same letter did not significantly differ at P< 0.05 according to the Duncan multiple range test. Three independent experiments were performed with similar results. OE, overexpressing; 1#, line of HsfA1aOE plants.
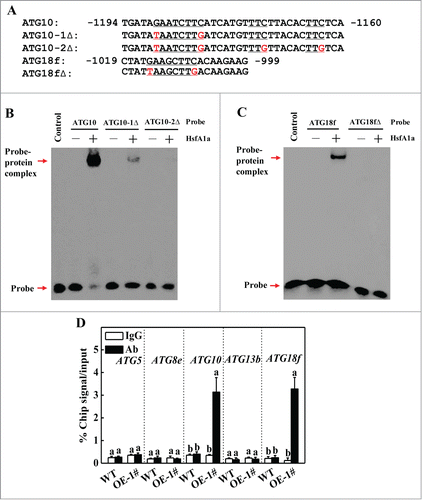
Figure 6. HsfA1a binds to the promoters of ATG10 and ATG18f in vitro and in vivo. (A) Oligonucleotide used in the electrophoretic mobility shift assays (EMSA). The ATG10 probe contains one direct HSE, whereas in the ATG10−1Δ and ATG10–2Δ probes the HSE core sequence was mutated. The ATG18f probe contains one direct HSE, whereas in the ATG18fΔ probe, the HSE core sequence was mutated. The WT and mutated HSE sequences are underlined. The mutated bases were indicated in red. (B and C) EMSA showing HsfA1a bound to the HSE sequences of the ATG10 or ATG18f promoters. Recombinant HsfA1a was purified from E. coli cells and used for DNA binding assays with ATG10, ATG10−1Δ, ATG10–2Δ, ATG18f, or ATG18fΔ as the probes. His was included as the negative control. (D) Direct binding of HsfA1a to the ATG10 and ATG18f promoters was analyzed using ChIP-qPCR in 35S-HsfA1a-HA-overexpressing (HsfA1aOE) plants. Six-wk-old HsfA1aOE plants were exposed to dehydration by withholding water and input chromatin was isolated from leaf samples on d 6. The epitope-tagged HsfA1a-chromatin complex was immunoprecipitated with an anti-HA antibody. A control reaction was processed side-by-side using mouse IgG. Input- and ChIP-DNA samples were quantified by qRT-PCR using primers specific for the promoters of the ATG genes. The ChIP results are presented as percentage of the input DNA. Means with the same letter did not significantly differ at P< 0.05 according to the Duncan multiple range test. Three independent experiments were performed with similar results. OE, overexpressing; 1#, line of HsfA1aOE plants.

Figure 7. Visualization of the accumulation of autophagosomes by confocal microscopy and transmission electron microscopy (TEM) in ATG10 and ATG18f-silenced plants under drought stress. (A) MDC-stained autophagosomes in the leaves of WT TRV, TRV-ATG10 and TRV-ATG18f plants or HsfA1aOE TRV, TRV-ATG10 and TRV-ATG18f plants. Six-wk-old plants were exposed to dehydration by withholding water and the leaves were MDC-stained and visualized on day 6 by fluorescence confocal microscopy. MDC-labeled structures are visible as green signals. Bars: 25 μm. (B) Relative autophagic activity normalized to the activity of WT TRV control plants in (A). Quantification of the MDC-stained autophagosomes in the leaves at each treatment was performed to calculate the autophagic activity relative to WT TRV control plants, which was set to 1. More than 300 mesophyll cells for each treatment were used for the quantification. (C) TEM images of autophagic structures in the mesophyll cells of WT TRV, TRV-ATG10 and TRV-ATG18f plants or HsfA1aOE TRV, TRV-ATG10 and TRV-ATG18f plants. Six-wk-old plants were exposed to dehydration by withholding water and the mesophyll cells were visualized on d 6 by TEM. Autophagic bodies are indicated by red arrows. Bars: 1 µm. (D) Relative autophagic activity normalized to the activity in WT TRV control plants in (C). More than 20 cells were used to quantify autophagic structures. Results represent the means ± SE. Means with the same letter did not significantly differ at P< 0.05 according to the Duncan multiple range test. Three independent experiments were performed with similar results. Cp, chloroplast; V, vacuole; S, starch; WT, wild-type; OE, overexpressing; 1#, line of HsfA1aOE plants.
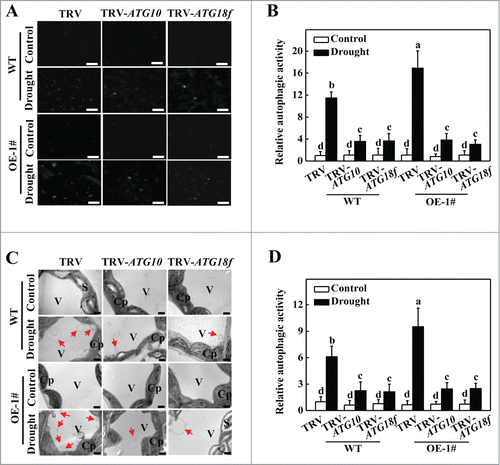
Figure 7. Visualization of the accumulation of autophagosomes by confocal microscopy and transmission electron microscopy (TEM) in ATG10 and ATG18f-silenced plants under drought stress. (A) MDC-stained autophagosomes in the leaves of WT TRV, TRV-ATG10 and TRV-ATG18f plants or HsfA1aOE TRV, TRV-ATG10 and TRV-ATG18f plants. Six-wk-old plants were exposed to dehydration by withholding water and the leaves were MDC-stained and visualized on day 6 by fluorescence confocal microscopy. MDC-labeled structures are visible as green signals. Bars: 25 μm. (B) Relative autophagic activity normalized to the activity of WT TRV control plants in (A). Quantification of the MDC-stained autophagosomes in the leaves at each treatment was performed to calculate the autophagic activity relative to WT TRV control plants, which was set to 1. More than 300 mesophyll cells for each treatment were used for the quantification. (C) TEM images of autophagic structures in the mesophyll cells of WT TRV, TRV-ATG10 and TRV-ATG18f plants or HsfA1aOE TRV, TRV-ATG10 and TRV-ATG18f plants. Six-wk-old plants were exposed to dehydration by withholding water and the mesophyll cells were visualized on d 6 by TEM. Autophagic bodies are indicated by red arrows. Bars: 1 µm. (D) Relative autophagic activity normalized to the activity in WT TRV control plants in (C). More than 20 cells were used to quantify autophagic structures. Results represent the means ± SE. Means with the same letter did not significantly differ at P< 0.05 according to the Duncan multiple range test. Three independent experiments were performed with similar results. Cp, chloroplast; V, vacuole; S, starch; WT, wild-type; OE, overexpressing; 1#, line of HsfA1aOE plants.

Figure 8. A proposed model for the induction of autophagy by HsfA1a in tomato plants under drought stress. HsfA1a is first activated under drought stress by increasing transcription and trimer formation. Then, activated HsfA1a binds to and upregulates the expression of ATG10 and ATG18f leading to an increase in autophagy. The increase in autophagy leads to an increase in the degradation of insoluble ubiquitinated protein aggregates and cell survival under drought stress.
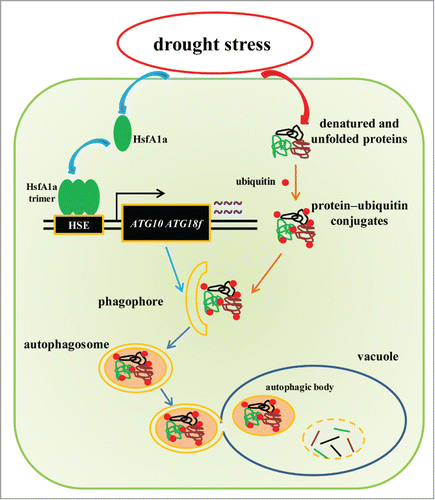
Figure 8. A proposed model for the induction of autophagy by HsfA1a in tomato plants under drought stress. HsfA1a is first activated under drought stress by increasing transcription and trimer formation. Then, activated HsfA1a binds to and upregulates the expression of ATG10 and ATG18f leading to an increase in autophagy. The increase in autophagy leads to an increase in the degradation of insoluble ubiquitinated protein aggregates and cell survival under drought stress.
Supplemental material

1098798_Supplemental_Material.zip

Download Zip (581.1 KB)