2,122
Views
31
CrossRef citations to date
0
Altmetric
Basic Research Paper

Autophagy of metallothioneins prevents TNF-induced oxidative stress and toxicity in hepatoma cells

, , , , , & show all
Pages 2184-2198 | Received 02 Apr 2013, Accepted 06 Oct 2015, Published online: 06 Jan 2016

Figures & data

Figure 1. Iron affects TNF and CHX toxicity in HTC cells. (A) Cells were exposed for 2 h to a precipitate of hydrated iron-phosphate, which spontaneously forms when FeCl3 is added to the medium, and subsequently treated with 20 ng/ml TNF plus 10 µg/ml CHX for another 6 h. Cells were then loaded for 15 min with acridine orange at a final concentration of 5 µg/ml in complete growth medium and analyzed by flow cytometry. Ten thousand cells were run each time in a FACScan flow cytometer; data were collected and analyzed with the CellQuest software. ‘Pale’ cells represent the population with the lowest red fluorescence (as illustrated in ) when exposed to green light, due to a reduced number of normal lysosomes. (B) Cells were incubated with either 1 µM apoferritin (ApoF) for 4 h or 250 µM deferiprone (Dfp) for 18 h before being exposed to TNF and CHX for 6 h. At the end of treatment, the number of ANXA5-positive and PI-negative cells (black bars) and of ‘pale’ cells (light gray bars) was measured on 5,000 and 10,000 cells per sample as described above. (C) Cells were treated with TNF and CHX as in (A), sequentially stained with LysoTracker Red and GelGreen as indicated in Materials and Methods and observed under a fluorescence microscope. The frame in the left panel (phase contrast) was electronically magnified and the red and green channels reproduced, either separately (middle 2 panels) or overlaid in the rightmost panel. Arrowheads indicate moderately shrunk cells undergoing initial LMP, but still retaining plasma membrane selective permeability, as is implied by their impermeability to GelGreen. The arrow points to a strongly condensed cell with fully permeabilized lysosomes, taking up the GelGreen dye, suggestive of a late phase of death (‘late apoptotic’ or ‘secondary necrotic’ cell). Data represent the means ± SD of at least 3 independent experiments. *, **, ***: P < 0.05, P < 0.01 and P < 0.001, respectively, vs TNF and CHX (ANOVA).
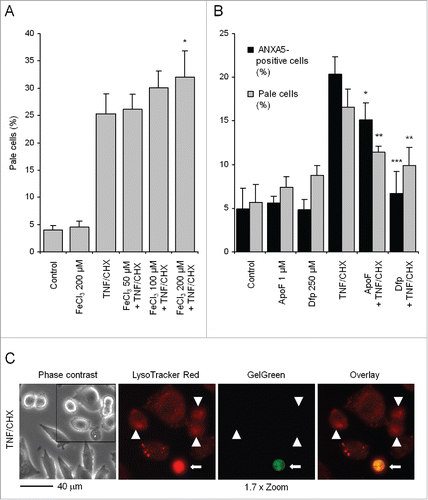
Figure 1. Iron affects TNF and CHX toxicity in HTC cells. (A) Cells were exposed for 2 h to a precipitate of hydrated iron-phosphate, which spontaneously forms when FeCl3 is added to the medium, and subsequently treated with 20 ng/ml TNF plus 10 µg/ml CHX for another 6 h. Cells were then loaded for 15 min with acridine orange at a final concentration of 5 µg/ml in complete growth medium and analyzed by flow cytometry. Ten thousand cells were run each time in a FACScan flow cytometer; data were collected and analyzed with the CellQuest software. ‘Pale’ cells represent the population with the lowest red fluorescence (as illustrated in Fig. 3D) when exposed to green light, due to a reduced number of normal lysosomes. (B) Cells were incubated with either 1 µM apoferritin (ApoF) for 4 h or 250 µM deferiprone (Dfp) for 18 h before being exposed to TNF and CHX for 6 h. At the end of treatment, the number of ANXA5-positive and PI-negative cells (black bars) and of ‘pale’ cells (light gray bars) was measured on 5,000 and 10,000 cells per sample as described above. (C) Cells were treated with TNF and CHX as in (A), sequentially stained with LysoTracker Red and GelGreen as indicated in Materials and Methods and observed under a fluorescence microscope. The frame in the left panel (phase contrast) was electronically magnified and the red and green channels reproduced, either separately (middle 2 panels) or overlaid in the rightmost panel. Arrowheads indicate moderately shrunk cells undergoing initial LMP, but still retaining plasma membrane selective permeability, as is implied by their impermeability to GelGreen. The arrow points to a strongly condensed cell with fully permeabilized lysosomes, taking up the GelGreen dye, suggestive of a late phase of death (‘late apoptotic’ or ‘secondary necrotic’ cell). Data represent the means ± SD of at least 3 independent experiments. *, **, ***: P < 0.05, P < 0.01 and P < 0.001, respectively, vs TNF and CHX (ANOVA).

Figure 2. TNF and CHX exposure triggers redox reactions that involve the lysosomal compartment. (A) Cells were left untreated (top panels), or treated with TNF and CHX as in (bottom panels). Cultures were then exposed for 30 min to 10 µM dichlorofluorescein diacetate (DCF-DA) in medium without phenol red, rinsed with fresh growth medium and observed under an inverted fluorescence microscope. Cells with evident TNF and CHX-related morphological alterations displayed a lysosomal-type punctate intense fluorescence (arrowheads), while other cells, in which morphological changes were not yet so established displayed less intense green fluorescence (arrows), suggesting the process to still be in a very early phase. (B) Cells were treated with TNF and CHX and sequentially loaded with 10 µM DCF-DA as in (A) and, just before observation, stained with 30 µg/ml of PI. The green fluorescent cells (showing ‘granular’ DCF-DA-positivity) do not take up PI, indicating that redox reactions occur in an early phase of the death process. (C) Cells were treated with TNF and CHX as in (A) and sequentially loaded with 10 µM DCF-DA and 25 nM LysoTracker Red DND-99 as described in Materials and Methods. Controls (upper panels) and cells treated with TNF and CHX (lower panels) were observed and photographed as in (A). Arrows indicate lysosomes that are not stained by DCF. The pictures shown in (A to C) are representative of 3 different experiments for each condition.
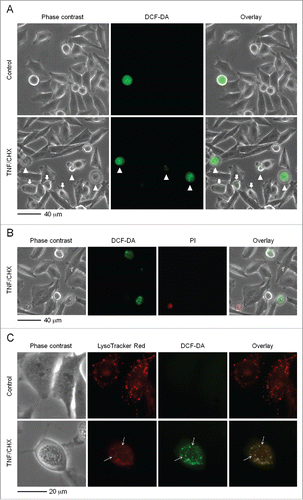
Figure 2. TNF and CHX exposure triggers redox reactions that involve the lysosomal compartment. (A) Cells were left untreated (top panels), or treated with TNF and CHX as in Figure. 1 (bottom panels). Cultures were then exposed for 30 min to 10 µM dichlorofluorescein diacetate (DCF-DA) in medium without phenol red, rinsed with fresh growth medium and observed under an inverted fluorescence microscope. Cells with evident TNF and CHX-related morphological alterations displayed a lysosomal-type punctate intense fluorescence (arrowheads), while other cells, in which morphological changes were not yet so established displayed less intense green fluorescence (arrows), suggesting the process to still be in a very early phase. (B) Cells were treated with TNF and CHX and sequentially loaded with 10 µM DCF-DA as in (A) and, just before observation, stained with 30 µg/ml of PI. The green fluorescent cells (showing ‘granular’ DCF-DA-positivity) do not take up PI, indicating that redox reactions occur in an early phase of the death process. (C) Cells were treated with TNF and CHX as in (A) and sequentially loaded with 10 µM DCF-DA and 25 nM LysoTracker Red DND-99 as described in Materials and Methods. Controls (upper panels) and cells treated with TNF and CHX (lower panels) were observed and photographed as in (A). Arrows indicate lysosomes that are not stained by DCF. The pictures shown in (A to C) are representative of 3 different experiments for each condition.

Figure 3. For figure legend, see page .Figure 3. Induction of autophagy and inhibition of lysosomal proteolysis protect from TNF and CHX-induced death. (A) Cells were transfected with ptfLC3, starved in amino acid-free medium (HBSS containing glucose) for 2 h and examined with a confocal microscope (left panel) for quantification (histograms) of yellow and red fluorescent dots/cell representing autophagosomes and autolysosomes, respectively. Amino acid deprivation increases number and size of both autophagosomes and autolysosomes, suggestive of enhanced autophagic flux. The number of cells examined for autophagosome and autolysosome quantification is indicated in each bar. (B) The kinetics of SQSTM1 degradation was assayed by western blotting (left panel, representative of 3 independent experiments) under both control conditions and following starvation for 2 h in HBSS/glucose, in the absence or presence of 100 µM E-64-d and 10 µM leupeptin (E64d/Leu, for the full period of starvation), to inhibit lysosomal proteolysis. Normalization was performed against the level of ACTB of each sample. The relative amount of SQSTM1 was expressed vs that of time 0 for each condition (histograms, right panel). (C) Cells starved as above for 2 h were exposed to TNF and CHX for 6 h in the absence or presence of 20 mM NH4Cl, added during the last 60 min of starvation, or of 100 µM E-64-d and 10 µM leupeptin for the whole period of starvation. The percentage of apoptotic-like cells (phosphatidylserine-positive and PI-negative) was then quantified by flow cytometry (5,000 cells were analyzed for each sample). Only occasional necrotic (PI positive) cells were found. (D) Cells were exposed for 6 h to TNF and CHX following 2 h of starvation (upper panel) or 1 h of incubation with NH4Cl (middle panel), loaded with AO and analyzed by flow cytometry on 10,000 cells. The fluorescence intensity peak of control cells was set approximately at channel 103 and retained for all measurements. Arrowheads indicate the peaks of the lowest red-fluorescent population (here referred to as maximally ‘pale’ cells) resulting from cells with the most reduced number of intact lysosomes due to LMP. Histograms (lower panel) show the percentage of these pale cells from electronic gating and counting. Yellow and red bars in the right panel of indicate the number (means ± SD) of autophagosomes and autolysosomes/cell, respectively; the number of cells analyzed for each condition is indicated inside relevant bars; *: P < 0.002 (Student t test). The asterisk in (B) indicates a nonspecific band. For (C) and (D) data and significance are as in . **, ***: P < 0.01 and P < 0.001 vs TNF and CHX.
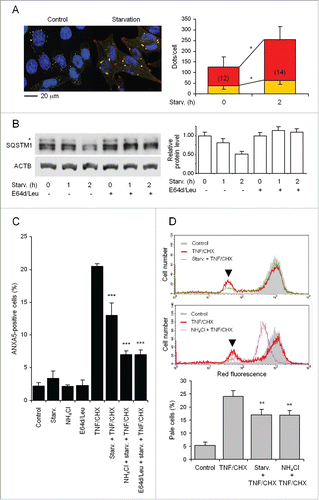
Figure 3. For figure legend, see page .Figure 3. Induction of autophagy and inhibition of lysosomal proteolysis protect from TNF and CHX-induced death. (A) Cells were transfected with ptfLC3, starved in amino acid-free medium (HBSS containing glucose) for 2 h and examined with a confocal microscope (left panel) for quantification (histograms) of yellow and red fluorescent dots/cell representing autophagosomes and autolysosomes, respectively. Amino acid deprivation increases number and size of both autophagosomes and autolysosomes, suggestive of enhanced autophagic flux. The number of cells examined for autophagosome and autolysosome quantification is indicated in each bar. (B) The kinetics of SQSTM1 degradation was assayed by western blotting (left panel, representative of 3 independent experiments) under both control conditions and following starvation for 2 h in HBSS/glucose, in the absence or presence of 100 µM E-64-d and 10 µM leupeptin (E64d/Leu, for the full period of starvation), to inhibit lysosomal proteolysis. Normalization was performed against the level of ACTB of each sample. The relative amount of SQSTM1 was expressed vs that of time 0 for each condition (histograms, right panel). (C) Cells starved as above for 2 h were exposed to TNF and CHX for 6 h in the absence or presence of 20 mM NH4Cl, added during the last 60 min of starvation, or of 100 µM E-64-d and 10 µM leupeptin for the whole period of starvation. The percentage of apoptotic-like cells (phosphatidylserine-positive and PI-negative) was then quantified by flow cytometry (5,000 cells were analyzed for each sample). Only occasional necrotic (PI positive) cells were found. (D) Cells were exposed for 6 h to TNF and CHX following 2 h of starvation (upper panel) or 1 h of incubation with NH4Cl (middle panel), loaded with AO and analyzed by flow cytometry on 10,000 cells. The fluorescence intensity peak of control cells was set approximately at channel 103 and retained for all measurements. Arrowheads indicate the peaks of the lowest red-fluorescent population (here referred to as maximally ‘pale’ cells) resulting from cells with the most reduced number of intact lysosomes due to LMP. Histograms (lower panel) show the percentage of these pale cells from electronic gating and counting. Yellow and red bars in the right panel of Figure 3A indicate the number (means ± SD) of autophagosomes and autolysosomes/cell, respectively; the number of cells analyzed for each condition is indicated inside relevant bars; *: P < 0.002 (Student t test). The asterisk in (B) indicates a nonspecific band. For (C) and (D) data and significance are as in Figure 1. **, ***: P < 0.01 and P < 0.001 vs TNF and CHX.

Figure 4. For figure legend, see page .Figure 4. Effect of MT upregulation and ensuing autophagy on TNF and CHX toxicity. (A) Cells were exposed to 50 µM ZnCl2 for 24 h. Changes of Mt1a (metallothionein 1A) and Mt2a mRNA levels were measured by real-time RT-PCR and presented as relative amounts with respect to untreated cells. (B) Cells were exposed for 24 h to the indicated concentrations of ZnCl2 and levels of Mt1a mRNA were analyzed by real-time RT-PCR and normalized to Gapdh mRNA (upper panel). Equal amounts of proteins from each sample were separated on a 12% denaturing gel by SDS-PAGE and transferred to a nitrocellulose membrane for probing with an anti-MT antibody (middle panel). Loading was assayed by reprobing the membrane with an anti-ACTB antibody (lower panel). (C) Cells were treated with ZnCl2 as in (A) and starved for different period of times to measure degradation rate of SQSTM1 in the absence or presence of E64d/Leu as in (representative of 3 independent experiments). The change in relative amounts of protein at various time points (histograms, right panel) indicates that treatment with 50 µM ZnCl2 to upregulate MTs does not substantially affect autophagic flux. To demonstrate autophagic sequestration of MT (D and E) cells were transfected with the plasmids encoding both human MT2A-mCherry and pEGFP-C1-LC3, either left untreated (D) or subsequently starved (E) in the presence of the various lysosomal inhibitors as indicated. Colocalization is not observed in unstarved cells (D), although it is in starved cells, where it is indicated by yellow puncta (E, arrowheads). To show lysosomal delivery of autophagocytosed MT (F and G), cells were transfected with both HsMT2A-GFP and the lysosomal marker LAMP1-mRFP. In unstarved cells (F) red and green fluorescence do not overlap. Upon starvation in the presence of various inhibitors of lysosomal degradation (G) several enlarged red-labeled, ring-shaped organelles representing lysosomes, which apparently have engulfed some intensely green-fluorescent material, indicate lysosomes containing undegraded HsMT2A-GFP (arrows). (H) Cells were treated with TNF and CHX following exposure to ZnCl2 for 24 h and ensuing starvation for 2 h. The percentage of apoptotic cells was determined by flow cytometry as in . (I) Maximally pale cells (arrowhead) were detected and quantified as in . Note almost complete protection in MT-upregulated, starved cells. Numerical data from 3 independent experiments are presented in the below histograms. For (H) and (I) 5,000 and 10,000 cells were analyzed for each sample, respectively. The asterisk in (C) indicates a nonspecific band. Data and statistical significance are as in . §§, §§§: P < 0.01 and P < 0.001 vs controls; ***: P < 0.001 vs TNF and CHX.
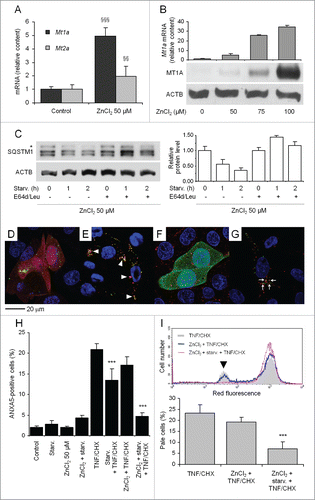
Figure 4. For figure legend, see page .Figure 4. Effect of MT upregulation and ensuing autophagy on TNF and CHX toxicity. (A) Cells were exposed to 50 µM ZnCl2 for 24 h. Changes of Mt1a (metallothionein 1A) and Mt2a mRNA levels were measured by real-time RT-PCR and presented as relative amounts with respect to untreated cells. (B) Cells were exposed for 24 h to the indicated concentrations of ZnCl2 and levels of Mt1a mRNA were analyzed by real-time RT-PCR and normalized to Gapdh mRNA (upper panel). Equal amounts of proteins from each sample were separated on a 12% denaturing gel by SDS-PAGE and transferred to a nitrocellulose membrane for probing with an anti-MT antibody (middle panel). Loading was assayed by reprobing the membrane with an anti-ACTB antibody (lower panel). (C) Cells were treated with ZnCl2 as in (A) and starved for different period of times to measure degradation rate of SQSTM1 in the absence or presence of E64d/Leu as in Figure 3B (representative of 3 independent experiments). The change in relative amounts of protein at various time points (histograms, right panel) indicates that treatment with 50 µM ZnCl2 to upregulate MTs does not substantially affect autophagic flux. To demonstrate autophagic sequestration of MT (D and E) cells were transfected with the plasmids encoding both human MT2A-mCherry and pEGFP-C1-LC3, either left untreated (D) or subsequently starved (E) in the presence of the various lysosomal inhibitors as indicated. Colocalization is not observed in unstarved cells (D), although it is in starved cells, where it is indicated by yellow puncta (E, arrowheads). To show lysosomal delivery of autophagocytosed MT (F and G), cells were transfected with both HsMT2A-GFP and the lysosomal marker LAMP1-mRFP. In unstarved cells (F) red and green fluorescence do not overlap. Upon starvation in the presence of various inhibitors of lysosomal degradation (G) several enlarged red-labeled, ring-shaped organelles representing lysosomes, which apparently have engulfed some intensely green-fluorescent material, indicate lysosomes containing undegraded HsMT2A-GFP (arrows). (H) Cells were treated with TNF and CHX following exposure to ZnCl2 for 24 h and ensuing starvation for 2 h. The percentage of apoptotic cells was determined by flow cytometry as in Figure 1B. (I) Maximally pale cells (arrowhead) were detected and quantified as in Figure 3C. Note almost complete protection in MT-upregulated, starved cells. Numerical data from 3 independent experiments are presented in the below histograms. For (H) and (I) 5,000 and 10,000 cells were analyzed for each sample, respectively. The asterisk in (C) indicates a nonspecific band. Data and statistical significance are as in Figure 1. §§, §§§: P < 0.01 and P < 0.001 vs controls; ***: P < 0.001 vs TNF and CHX.

Figure 5. Atg7 silencing abrogates protection from TNF and CHX by MT upregulation and starvation-induced-enhanced autophagy. (A) Cells were incubated for 72 h with 100 nM siRNA specific for rat Atg7 and treated with 50 µM ZnCl2 during the last 24 h. Atg7, Mt1a and Mt2a mRNAs were quantified by real time RT-PCR and expressed as relative amounts vs cells transfected with nonspecific siRNAs. (B) The effect of Atg7 silencing on starvation-induced autophagic flux was assayed by transfecting mock- and Atg7-silenced cells with the ptfLC3 construct as described in the legend to . Quantification of autophagosomes and autolysosomes was performed on single-cell images obtained by confocal microscopy. (C) MT was induced with 50 µM ZnCl2 in both control- and Atg7-silenced cells, starved as indicated and exposed to TNF and CHX for another 6 h. Adherent and floating cells were pooled and analyzed by FACS with the ANXA5 and PI technique. At least 5,000 cells were assayed for each condition. (D) Mock- and Atg7-silenced cells were treated with various concentrations of FeCl3, starved and treated with TNF and CHX as described in . The percentage of pale cells was quantified by FACS as in . For panels A, C and D data and statistical analysis of differences are as in . §, §§§: P < 0.05 and P < 0.001 vs control siRNA-treated cells; **, ***: P < 0.01 and P < 0.001 vs TNF and CHX. For panel B, yellow and red bars indicate the number (mean ± SD) of autophagosomes and autolysosomes/cell, respectively. The number of cells analyzed for each condition is indicated inside relevant bars. *: P < 0.005 (Student t test). siControl, siAtg7: nonspecific and Atg7-specific siRNAs, respectively.
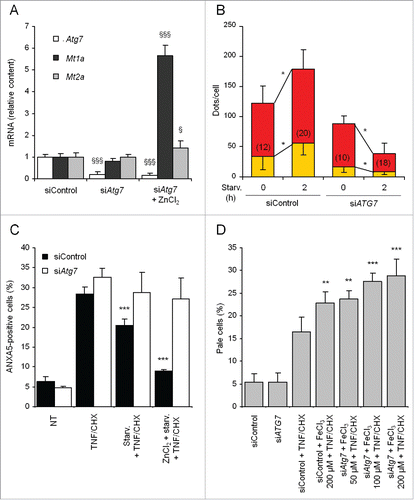
Figure 5. Atg7 silencing abrogates protection from TNF and CHX by MT upregulation and starvation-induced-enhanced autophagy. (A) Cells were incubated for 72 h with 100 nM siRNA specific for rat Atg7 and treated with 50 µM ZnCl2 during the last 24 h. Atg7, Mt1a and Mt2a mRNAs were quantified by real time RT-PCR and expressed as relative amounts vs cells transfected with nonspecific siRNAs. (B) The effect of Atg7 silencing on starvation-induced autophagic flux was assayed by transfecting mock- and Atg7-silenced cells with the ptfLC3 construct as described in the legend to Figure 3A. Quantification of autophagosomes and autolysosomes was performed on single-cell images obtained by confocal microscopy. (C) MT was induced with 50 µM ZnCl2 in both control- and Atg7-silenced cells, starved as indicated and exposed to TNF and CHX for another 6 h. Adherent and floating cells were pooled and analyzed by FACS with the ANXA5 and PI technique. At least 5,000 cells were assayed for each condition. (D) Mock- and Atg7-silenced cells were treated with various concentrations of FeCl3, starved and treated with TNF and CHX as described in Figure 1A. The percentage of pale cells was quantified by FACS as in Figure 1A. For panels A, C and D data and statistical analysis of differences are as in Figure 1. §, §§§: P < 0.05 and P < 0.001 vs control siRNA-treated cells; **, ***: P < 0.01 and P < 0.001 vs TNF and CHX. For panel B, yellow and red bars indicate the number (mean ± SD) of autophagosomes and autolysosomes/cell, respectively. The number of cells analyzed for each condition is indicated inside relevant bars. *: P < 0.005 (Student t test). siControl, siAtg7: nonspecific and Atg7-specific siRNAs, respectively.

Figure 6. MT silencing abrogates protection from TNF and CHX conferred by MT upregulation. (A) Cells were incubated for 72 h with 50 nM siRNAs targeting rat Mt1a and Mt2a (dark and light gray bars, respectively) and treated with 50 µM ZnCl2 during the last 24 h of siRNA treatment. Mt1a and Mt2a mRNAs were quantified by real-time RT-PCR and expressed as relative amounts vs cells transfected with nonspecific siRNAs. The effect of mock and combined Mt1a and Mt2a silencing (black and white bars, respectively, (B), as well as of Mt1a alone (C) or Mt2a alone (D) knockdown on protection by ZnCl2 and starvation-induced autophagy against TNF and CHX toxicity was assayed in cells silenced as indicated, treated with ZnCl2 to upregulate MT, starved for 2 h in HBSS/glucose and eventually exposed to TNF and CHX. Adherent and floating cells were pooled and analyzed by FACS with the ANXA5 and PI technique. At least 5,000 cells were assayed for each condition. Data and statistical significance are as in . *, **, ***: P < 0.05, P < 0.01 and P < 0.001 vs TNF- and CHX-treated cells (panels B, C and D) or mock-silenced cells treated with ZnCl2 (panel A). §§: p < 0.01 vs cells silenced with siRNAs against both Mt1a and Mt2a and treated with TNF and CHX (panel B). siControl, siMt1a and siMt2a: nonspecific, Mt1a- and Mt2a-specific siRNAs, respectively.
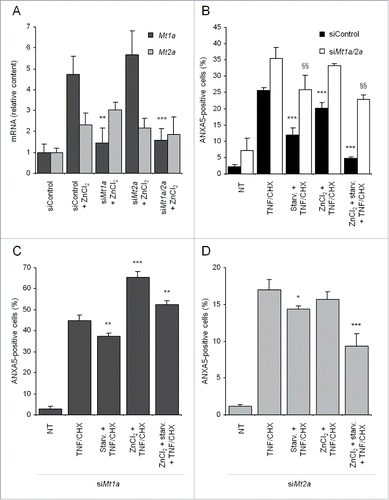
Figure 6. MT silencing abrogates protection from TNF and CHX conferred by MT upregulation. (A) Cells were incubated for 72 h with 50 nM siRNAs targeting rat Mt1a and Mt2a (dark and light gray bars, respectively) and treated with 50 µM ZnCl2 during the last 24 h of siRNA treatment. Mt1a and Mt2a mRNAs were quantified by real-time RT-PCR and expressed as relative amounts vs cells transfected with nonspecific siRNAs. The effect of mock and combined Mt1a and Mt2a silencing (black and white bars, respectively, (B), as well as of Mt1a alone (C) or Mt2a alone (D) knockdown on protection by ZnCl2 and starvation-induced autophagy against TNF and CHX toxicity was assayed in cells silenced as indicated, treated with ZnCl2 to upregulate MT, starved for 2 h in HBSS/glucose and eventually exposed to TNF and CHX. Adherent and floating cells were pooled and analyzed by FACS with the ANXA5 and PI technique. At least 5,000 cells were assayed for each condition. Data and statistical significance are as in Figure 1. *, **, ***: P < 0.05, P < 0.01 and P < 0.001 vs TNF- and CHX-treated cells (panels B, C and D) or mock-silenced cells treated with ZnCl2 (panel A). §§: p < 0.01 vs cells silenced with siRNAs against both Mt1a and Mt2a and treated with TNF and CHX (panel B). siControl, siMt1a and siMt2a: nonspecific, Mt1a- and Mt2a-specific siRNAs, respectively.

Reprints and Corporate Permissions

Please note: Selecting permissions does not provide access to the full text of the article, please see our help page How do I view content?

To request a reprint or corporate permissions for this article, please click on the relevant link below:

Academic Permissions

Please note: Selecting permissions does not provide access to the full text of the article, please see our help page How do I view content?

Obtain permissions instantly via Rightslink by clicking on the button below:

If you are unable to obtain permissions via Rightslink, please complete and submit this Permissions form. For more information, please visit our Permissions help page.