5,279
Views
119
CrossRef citations to date
0
Altmetric
Basic Research Paper

A new microRNA signal pathway regulated by long noncoding RNA TGFB2-OT1 in autophagy and inflammation of vascular endothelial cells

, , , , , , , , & show all
Pages 2172-2183 | Received 19 Mar 2015, Accepted 06 Oct 2015, Published online: 06 Jan 2016

Figures & data

Figure 1. The increased TGFB2-OT1 level induced by LPS and oxLDL was inhibited by 3BDO. (A) LPS increased TGFB2-OT1 expression and 3BDO (120 μM) inhibited the increase of TGFB2-OT1 induced by 1 μg/ml LPS for 12 h in HUVECs with in situ hybridization. (B) Quantified real-time PCR analysis of RNA levels of TGFB2-OT1 after HUVECs were exposed to 1 μg/ml or 5 μg/ml LPS for 3 h, and treated with 1 μg/ml LPS for 3 h or 12 h. (C) Quantified real-time PCR analysis of TGFB2-OT1 expression in HUVECs treated with 1 μg/ml LPS in presence or absence of 120 μM 3BDO for 3 h. (D) HUVECs were exposed to 50 μg/ml nLDL and oxLDL in presence or absence of 3BDO (60 μM and 120 μM) for 24 h, then TGFB2-OT1 levels were determined by qPCR. *, P < 0.05; **, P < 0.01; n = 3.
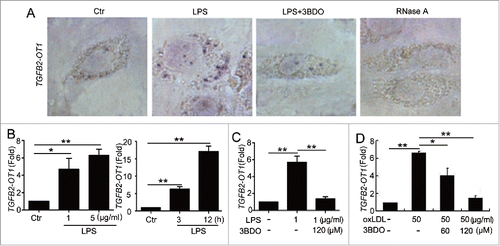
Figure 1. The increased TGFB2-OT1 level induced by LPS and oxLDL was inhibited by 3BDO. (A) LPS increased TGFB2-OT1 expression and 3BDO (120 μM) inhibited the increase of TGFB2-OT1 induced by 1 μg/ml LPS for 12 h in HUVECs with in situ hybridization. (B) Quantified real-time PCR analysis of RNA levels of TGFB2-OT1 after HUVECs were exposed to 1 μg/ml or 5 μg/ml LPS for 3 h, and treated with 1 μg/ml LPS for 3 h or 12 h. (C) Quantified real-time PCR analysis of TGFB2-OT1 expression in HUVECs treated with 1 μg/ml LPS in presence or absence of 120 μM 3BDO for 3 h. (D) HUVECs were exposed to 50 μg/ml nLDL and oxLDL in presence or absence of 3BDO (60 μM and 120 μM) for 24 h, then TGFB2-OT1 levels were determined by qPCR. *, P < 0.05; **, P < 0.01; n = 3.

Figure 2. The increased NUPR1 and TIA1 levels induced by LPS and oxLDL were inhibited by 3BDO. (A) HUVECs were exposed to 50 μg/ml nLDL or oxLDL with or without 3BDO (60 μM) for 24 h, then 20 and 40 μg cell extracts was loaded on the SDS-PAGE respectively. Western blot analysis of NUPR1 and TIA1 protein levels, with ACTB and Ponceau staining as the loading control, and (B) quantification. (C) HUVECs were treated with LPS (1 μg/ml, 6 h) with or without 3BDO (60 μM), then 20 and 40 μg cell extracts was loaded on SDS-PAGE respectively. Western blot analysis of TIA1 protein level, with ACTB and Ponceau staining as the loading control, and (D) quantification. *, P < 0.05; **P < 0.01; n = 3.
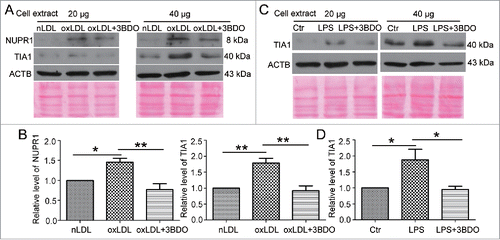
Figure 2. The increased NUPR1 and TIA1 levels induced by LPS and oxLDL were inhibited by 3BDO. (A) HUVECs were exposed to 50 μg/ml nLDL or oxLDL with or without 3BDO (60 μM) for 24 h, then 20 and 40 μg cell extracts was loaded on the SDS-PAGE respectively. Western blot analysis of NUPR1 and TIA1 protein levels, with ACTB and Ponceau staining as the loading control, and (B) quantification. (C) HUVECs were treated with LPS (1 μg/ml, 6 h) with or without 3BDO (60 μM), then 20 and 40 μg cell extracts was loaded on SDS-PAGE respectively. Western blot analysis of TIA1 protein level, with ACTB and Ponceau staining as the loading control, and (D) quantification. *, P < 0.05; **P < 0.01; n = 3.

Figure 3. NUPR1 and TIA1 were involved in regulation of TGFB2-OT1 level. qPCR analysis of TGFB2-OT1 mRNA levels in HUVECs subjected to scrambled siRNA (Scr) or NUPR1 siRNA (siNUPR1, 40 nM) for 24 h, then exposed to LPS at various concentrations for 3 h (A) or treated with 1 μg/ml LPS for 3 or 12 h (B). (C) qPCR analysis of TGFB2-OT1 mRNA levels in HUVECs subjected to scrambled siRNA (Scr) or TIA1 siRNA (siTIA1, 40 nM) for 24 h, then treated with 1 μg/ml LPS for 6 h. (D) Western blot analysis of the TIA1 protein level in HUVECs subjected to scrambled siRNA (Scr) or NUPR1 siRNA (siNUPR1, 40 nM) for 24 h, then exposed to 1 μg/ml LPS for 6 h. *, P < 0.05; **, P < 0.01; #, P > 0.05; n = 3.
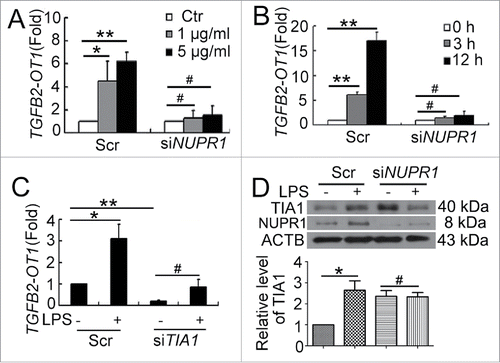
Figure 3. NUPR1 and TIA1 were involved in regulation of TGFB2-OT1 level. qPCR analysis of TGFB2-OT1 mRNA levels in HUVECs subjected to scrambled siRNA (Scr) or NUPR1 siRNA (siNUPR1, 40 nM) for 24 h, then exposed to LPS at various concentrations for 3 h (A) or treated with 1 μg/ml LPS for 3 or 12 h (B). (C) qPCR analysis of TGFB2-OT1 mRNA levels in HUVECs subjected to scrambled siRNA (Scr) or TIA1 siRNA (siTIA1, 40 nM) for 24 h, then treated with 1 μg/ml LPS for 6 h. (D) Western blot analysis of the TIA1 protein level in HUVECs subjected to scrambled siRNA (Scr) or NUPR1 siRNA (siNUPR1, 40 nM) for 24 h, then exposed to 1 μg/ml LPS for 6 h. *, P < 0.05; **, P < 0.01; #, P > 0.05; n = 3.

Figure 4. MIR3960 and MIR4488 directly bind to TGFB2-OT1. (A) qPCR analysis of MIR3960 and MIR4488 level in HUVECs treated with or without 3BDO (0, 15, 30 and 60 μM) for 24 h and (B) transfected with the empty vector pCMV6 (0.8 μg/cm2, indicated by 0 in the figure) or pCMV6-TGFB2-OT1 plasmid (0.2, 0.4 and 0.8 μg/cm2) for 24 h. (C) Luciferase activity assay with Luc-TGFB2-OT1-WT and Luc-TGFB2-OT1-3960Δ plasmids cotransfected into HEK293 cells with 80 nM MIR3960 mimics or negative control for 24 h. (D) Luciferase activity assay with Luc-TGFB2-OT1-WT and Luc-TGFB2-OT1-4488Δ plasmids cotransfected into HEK293 cells with 80 nM MIR4488 mimics or negative control for 24 h. *, P < 0.05; **, P < 0.01; n = 3.
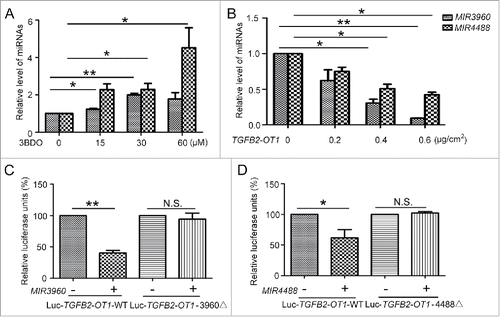
Figure 4. MIR3960 and MIR4488 directly bind to TGFB2-OT1. (A) qPCR analysis of MIR3960 and MIR4488 level in HUVECs treated with or without 3BDO (0, 15, 30 and 60 μM) for 24 h and (B) transfected with the empty vector pCMV6 (0.8 μg/cm2, indicated by 0 in the figure) or pCMV6-TGFB2-OT1 plasmid (0.2, 0.4 and 0.8 μg/cm2) for 24 h. (C) Luciferase activity assay with Luc-TGFB2-OT1-WT and Luc-TGFB2-OT1-3960Δ plasmids cotransfected into HEK293 cells with 80 nM MIR3960 mimics or negative control for 24 h. (D) Luciferase activity assay with Luc-TGFB2-OT1-WT and Luc-TGFB2-OT1-4488Δ plasmids cotransfected into HEK293 cells with 80 nM MIR4488 mimics or negative control for 24 h. *, P < 0.05; **, P < 0.01; n = 3.

Figure 5. MIR3960, MIR4488 and MIR4459 targeted CERS1, NAT8L and LARP1. Western blot analysis of protein levels of CERS1 (A) and NAT8L (B) in HUVECs transfected with 25 and 50 nM MIR3960 (A), MIR4488 (B) mimics, inhibitor or negative control for 24 h and quantification. (C) Western blot analysis of protein levels of LARP1 in HEK293 cells (left) and HUVECs (right) transfected with 25 and 50 nM MIR4459 mimics or negative control for 24 h and quantification. (D) Luciferase activity assay with Lu-CERS1-3′UTR, Lu-NAT8L-3′UTR, and Lu-LARP1-3′UTR plasmids cotransfected into HEK293 cells with 50 nM MIR3960, MIR4488 and MIR4459 mimics for 24 h, a negative miRNA as a control. *, P < 0.05; **, P < 0.01; n = 3.
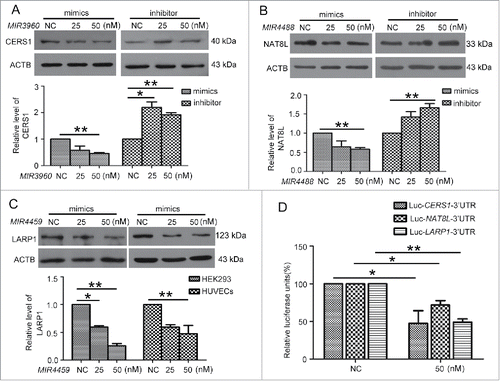
Figure 5. MIR3960, MIR4488 and MIR4459 targeted CERS1, NAT8L and LARP1. Western blot analysis of protein levels of CERS1 (A) and NAT8L (B) in HUVECs transfected with 25 and 50 nM MIR3960 (A), MIR4488 (B) mimics, inhibitor or negative control for 24 h and quantification. (C) Western blot analysis of protein levels of LARP1 in HEK293 cells (left) and HUVECs (right) transfected with 25 and 50 nM MIR4459 mimics or negative control for 24 h and quantification. (D) Luciferase activity assay with Lu-CERS1-3′UTR, Lu-NAT8L-3′UTR, and Lu-LARP1-3′UTR plasmids cotransfected into HEK293 cells with 50 nM MIR3960, MIR4488 and MIR4459 mimics for 24 h, a negative miRNA as a control. *, P < 0.05; **, P < 0.01; n = 3.

Figure 6. 3BDO and TGFB2-OT1 overexpression regulated the protein levels of CERS1, LARP1 and NAT8L. (A) Western blot analysis of protein levels of CERS1, LARP1 and NAT8L in HUVECs treated with 3BDO (0, 15, 30, 60 and 120 μM) for 24 h and (B) quantification. (C) Western blot analysis of protein levels of CERS1, LARP1 and NAT8L in HEK293 cells transfected with the empty vector pCMV6 (0.8 μg/cm2, indicated by 0 in the figure) or pCMV6-TGFB2-OT1 plasmid (0.2, 0.4 and 0.8 μg/cm2) for 48 h and (D) quantification. *, P < 0.05; **, P < 0.01; n = 3.
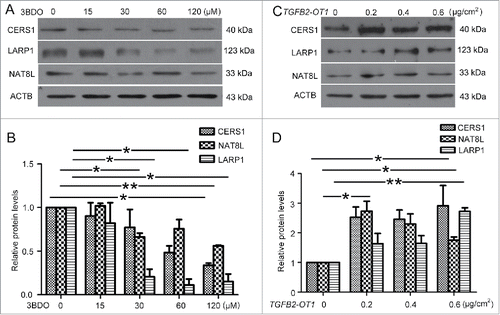
Figure 6. 3BDO and TGFB2-OT1 overexpression regulated the protein levels of CERS1, LARP1 and NAT8L. (A) Western blot analysis of protein levels of CERS1, LARP1 and NAT8L in HUVECs treated with 3BDO (0, 15, 30, 60 and 120 μM) for 24 h and (B) quantification. (C) Western blot analysis of protein levels of CERS1, LARP1 and NAT8L in HEK293 cells transfected with the empty vector pCMV6 (0.8 μg/cm2, indicated by 0 in the figure) or pCMV6-TGFB2-OT1 plasmid (0.2, 0.4 and 0.8 μg/cm2) for 48 h and (D) quantification. *, P < 0.05; **, P < 0.01; n = 3.

Figure 7. TGFB2-OT1 promoted SQSTM1 translation, RELA nuclear translocation and IL6 and IL8 production in HUVECs. (A) Western blot analysis of SQSTM1 protein level in HUVECs transfected with 0.01, 0.05, 0.1, 0.2 μg/ml of pCMV6 or pCMV6-TGFB2-OT1 for 48 h. This result is representative of 3 independent experiments. (B) Immunostaining of SQSTM1 in HUVECs transfected with pCMV6 or pCMV6-TGFB2-OT1 (0.2 μg/ml) for 48 h, and the proportion of cells containing SQSTM1 puncta (> 5). The arrows indicate SQSTM1 puncta in cells. Bar: 16 μm. (C) Western blot analysis of SQSTM1 protein level in HUVECs transfected with pCMV6 or pCMV6-TGFB2-OT1 (0.2 μg/ml) for 12 h, then treated with or without cycloheximide (CHX) for 12 h. (D) Western blot analysis of SQSTM1 protein level in HUVECs transfected with 25 and 50 nM MIR4459 mimics or negative control for 24 h. (E) Representative photomicrographs of immunofluorescence staining showing RELA nuclear translocation in HUVECs transfected with pCMV6 or pCMV6-TGFB2-OT1 (0.4 μg/ml) for 48 h. Bar: 16 μm. (F) Immunofluorescent graphs of RELA nuclear translocation in HUVECs transfected with pCMV6, pCMV6-TGFB2-OT1, or both siRNA against SQSTM1 and pCMV6-TGFB2-OT1 for 48 h. n indicates the nuclear. Bar: 16 μm. (G) ELISA of IL6 and IL8 production in HUVECs transfected with 0.4 μg/ml pCMV6 or pCMV6-TGFB2-OT1 for 48 h, then exposed to 3BDO (60 μM) for 6 h. (H) Western blot analysis of cleaved-CASP1 protein level in HUVECs transfected with 0.4 μg/ml pCMV6 or pCMV6-TGFB2-OT1 for 48 h and quantification. (I) qPCR analysis of mRNA levels of TGFB2-OT1 and IL1B in HUVECs transfected with 0.4 μg/ml pCMV6 or pCMV6-TGFB2-OT1 for 48 h, then exposed to 3BDO (60 μM) for 12 h. *, P < 0.05; **, P < 0.01; n = 3.
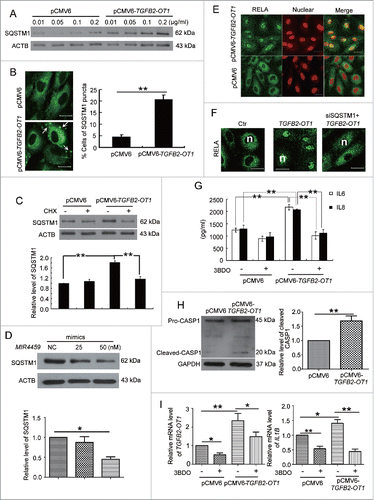
Figure 7. TGFB2-OT1 promoted SQSTM1 translation, RELA nuclear translocation and IL6 and IL8 production in HUVECs. (A) Western blot analysis of SQSTM1 protein level in HUVECs transfected with 0.01, 0.05, 0.1, 0.2 μg/ml of pCMV6 or pCMV6-TGFB2-OT1 for 48 h. This result is representative of 3 independent experiments. (B) Immunostaining of SQSTM1 in HUVECs transfected with pCMV6 or pCMV6-TGFB2-OT1 (0.2 μg/ml) for 48 h, and the proportion of cells containing SQSTM1 puncta (> 5). The arrows indicate SQSTM1 puncta in cells. Bar: 16 μm. (C) Western blot analysis of SQSTM1 protein level in HUVECs transfected with pCMV6 or pCMV6-TGFB2-OT1 (0.2 μg/ml) for 12 h, then treated with or without cycloheximide (CHX) for 12 h. (D) Western blot analysis of SQSTM1 protein level in HUVECs transfected with 25 and 50 nM MIR4459 mimics or negative control for 24 h. (E) Representative photomicrographs of immunofluorescence staining showing RELA nuclear translocation in HUVECs transfected with pCMV6 or pCMV6-TGFB2-OT1 (0.4 μg/ml) for 48 h. Bar: 16 μm. (F) Immunofluorescent graphs of RELA nuclear translocation in HUVECs transfected with pCMV6, pCMV6-TGFB2-OT1, or both siRNA against SQSTM1 and pCMV6-TGFB2-OT1 for 48 h. n indicates the nuclear. Bar: 16 μm. (G) ELISA of IL6 and IL8 production in HUVECs transfected with 0.4 μg/ml pCMV6 or pCMV6-TGFB2-OT1 for 48 h, then exposed to 3BDO (60 μM) for 6 h. (H) Western blot analysis of cleaved-CASP1 protein level in HUVECs transfected with 0.4 μg/ml pCMV6 or pCMV6-TGFB2-OT1 for 48 h and quantification. (I) qPCR analysis of mRNA levels of TGFB2-OT1 and IL1B in HUVECs transfected with 0.4 μg/ml pCMV6 or pCMV6-TGFB2-OT1 for 48 h, then exposed to 3BDO (60 μM) for 12 h. *, P < 0.05; **, P < 0.01; n = 3.

Figure 8. Conceptual schematic of the miRNA signal pathway regulated by TGFB2-OT1 in autophagy and inflammation. LPS and oxLDL promote TIA1 expression via NUPR1. TIA1 is responsible for TGFB2-OT1 processing from 3′UTR of TGFB2. TGFB2-OT1, as a miRNA sponge, decoys MIR3960, MIR4488, and MIR4459, then elevates CERS1, NAT8L, ATG13, and LARP1 protein levels. LARP1 further increases the levels of ATG3, ATG7 and SQSTM1. CERS1 and NAT8L regulate autophagy by affecting mitochondria. ATG13, ATG3 and ATG7 modulate autophagy. The elevated synthesis of SQSTM1 protein activates RELA and CASP1, increase levels of inflammatory cytokines IL6, IL8 and IL1B, and thereby induce inflammation. 3BDO induces TIA1 phosphorylation via FKBP1A and MTORC1, which may result in inhibition of TGFB2-OT1 processing, autophagy and inflammation induced by TGFB2-OT1.
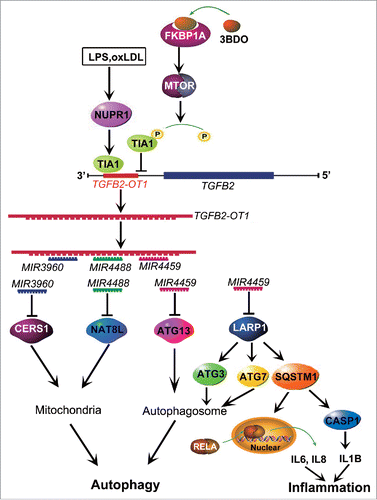
Figure 8. Conceptual schematic of the miRNA signal pathway regulated by TGFB2-OT1 in autophagy and inflammation. LPS and oxLDL promote TIA1 expression via NUPR1. TIA1 is responsible for TGFB2-OT1 processing from 3′UTR of TGFB2. TGFB2-OT1, as a miRNA sponge, decoys MIR3960, MIR4488, and MIR4459, then elevates CERS1, NAT8L, ATG13, and LARP1 protein levels. LARP1 further increases the levels of ATG3, ATG7 and SQSTM1. CERS1 and NAT8L regulate autophagy by affecting mitochondria. ATG13, ATG3 and ATG7 modulate autophagy. The elevated synthesis of SQSTM1 protein activates RELA and CASP1, increase levels of inflammatory cytokines IL6, IL8 and IL1B, and thereby induce inflammation. 3BDO induces TIA1 phosphorylation via FKBP1A and MTORC1, which may result in inhibition of TGFB2-OT1 processing, autophagy and inflammation induced by TGFB2-OT1.
Supplemental material

Supplementary_material.zip

Download Zip (7.5 MB)

Reprints and Corporate Permissions

Please note: Selecting permissions does not provide access to the full text of the article, please see our help page How do I view content?

To request a reprint or corporate permissions for this article, please click on the relevant link below:

Academic Permissions

Please note: Selecting permissions does not provide access to the full text of the article, please see our help page How do I view content?

Obtain permissions instantly via Rightslink by clicking on the button below:

If you are unable to obtain permissions via Rightslink, please complete and submit this Permissions form. For more information, please visit our Permissions help page.