3,340
Views
69
CrossRef citations to date
0
Altmetric
Translational Research Paper

Autophagy mediated CoCrMo particle-induced peri-implant osteolysis by promoting osteoblast apoptosis

, , , , , , , , , , , , , , , & show all
Pages 2358-2369 | Received 27 Mar 2015, Accepted 06 Oct 2015, Published online: 06 Jan 2016

Figures & data

Figure 1. Activation of autophagy following exposure to CoPs in murine calvaria resorption models and osteoblast cells. (A) Immunofluorescence was performed to examine the expression of LC3 in osteoblasts. Sections of murine calvaria are presented for animals from each group. Scale bar: 50 µm. Red, LC3; green, osteoblasts (BGLAP); blue, DAPI nuclear staining. (B) Immunofluorescence was performed to examine the expression of LC3 in osteoblast cells. Cells were treated with 50 µg/ml CoPs for 12 h. Scale bar: 10 µm. Red, LC3; blue, DAPI nuclear staining. (C) Quantification of the percentage of cells with LC3 puncta shown in (B). Data are presented as the means ± S.E.M. from 3 independent experiments. **, P < 0.01 vs. control. (D) Western blots performed after osteoblast cells were treated with various concentrations (0, 10, 50, 100 µg/ml) of CoPs for 12 h. Rap, rapamycin. (E) Western blots performed after osteoblast cells were cultured in CQ for 3 h prior to being treated with 50 µg/ml CoPs for 12 h. (F) Transmission electron microscopy of osteoblasts cultured with or without 10 mM 3-MA prior to being treated with 50 µg/ml CoPs for 12 h. The double-membrane autophagosome (AP) containing CoPs clusters and the rough endoplasmic reticulum are shown in the middle and right images of the upper panel. High-magnification view of an autolysosome containing CoPs clusters, partially degraded ribosomes and rough endoplasmic reticulum in the middle image of the lower panel. AVd, degradative autophagic vacuole.
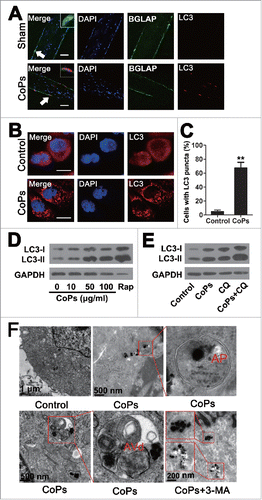
Figure 1. Activation of autophagy following exposure to CoPs in murine calvaria resorption models and osteoblast cells. (A) Immunofluorescence was performed to examine the expression of LC3 in osteoblasts. Sections of murine calvaria are presented for animals from each group. Scale bar: 50 µm. Red, LC3; green, osteoblasts (BGLAP); blue, DAPI nuclear staining. (B) Immunofluorescence was performed to examine the expression of LC3 in osteoblast cells. Cells were treated with 50 µg/ml CoPs for 12 h. Scale bar: 10 µm. Red, LC3; blue, DAPI nuclear staining. (C) Quantification of the percentage of cells with LC3 puncta shown in (B). Data are presented as the means ± S.E.M. from 3 independent experiments. **, P < 0.01 vs. control. (D) Western blots performed after osteoblast cells were treated with various concentrations (0, 10, 50, 100 µg/ml) of CoPs for 12 h. Rap, rapamycin. (E) Western blots performed after osteoblast cells were cultured in CQ for 3 h prior to being treated with 50 µg/ml CoPs for 12 h. (F) Transmission electron microscopy of osteoblasts cultured with or without 10 mM 3-MA prior to being treated with 50 µg/ml CoPs for 12 h. The double-membrane autophagosome (AP) containing CoPs clusters and the rough endoplasmic reticulum are shown in the middle and right images of the upper panel. High-magnification view of an autolysosome containing CoPs clusters, partially degraded ribosomes and rough endoplasmic reticulum in the middle image of the lower panel. AVd, degradative autophagic vacuole.

Figure 2. The ERN1-MAPK8 pathway mediated the activation of autophagy induced by CoPs. (A) Western blots performed after osteoblast cells were incubated with CoPs (50 µg/ml) for 12 h. (B) The density of the western blots bands shown in (A) was quantified using ImageJ software. (C) Western blots performed after osteoblast cells were incubated with siCtrl or siErn1 before being stimulated with CoPs (50 µg/ml) for 12 h. siCtrl, siControl. (D) The density of the western blots bands shown in (C) was quantified using ImageJ software. (E) Western blots performed after fibroblast cells were incubated with SP600125 (15 µM) before being stimulated with CoPs (50 µg/ml) for 12 h. (F) The density of the western blots bands shown in (E) was quantified using ImageJ software. Data are presented as means ± S.E.M. from 3 independent experiments. *, P < 0.05 and **, P < 0.01 vs. control; ##, P < 0.01 vs. CoPs group.
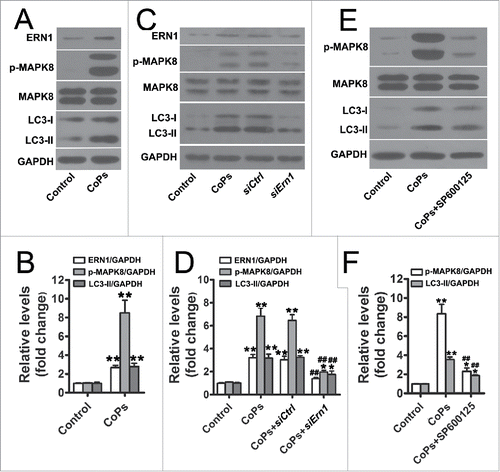
Figure 2. The ERN1-MAPK8 pathway mediated the activation of autophagy induced by CoPs. (A) Western blots performed after osteoblast cells were incubated with CoPs (50 µg/ml) for 12 h. (B) The density of the western blots bands shown in (A) was quantified using ImageJ software. (C) Western blots performed after osteoblast cells were incubated with siCtrl or siErn1 before being stimulated with CoPs (50 µg/ml) for 12 h. siCtrl, siControl. (D) The density of the western blots bands shown in (C) was quantified using ImageJ software. (E) Western blots performed after fibroblast cells were incubated with SP600125 (15 µM) before being stimulated with CoPs (50 µg/ml) for 12 h. (F) The density of the western blots bands shown in (E) was quantified using ImageJ software. Data are presented as means ± S.E.M. from 3 independent experiments. *, P < 0.05 and **, P < 0.01 vs. control; ##, P < 0.01 vs. CoPs group.

Figure 3. Autophagy mediated the increase in osteoblast apoptosis induced by CoPs. (A) Flow cytometry analysis of ANXA5 and propidium iodide staining of osteoblast cells cultured with various concentrations (0, 10, 50, 100, 200 µg/ml) of CoPs for 24 h. (B) Quantification analysis of apoptotic cells in (A) (both upper- and lower-right quadrants in representative dot plots as shown). Data are represented as means ± S.D. from 3 independent experiments. *, P < 0.05 and **, P < 0.01 vs. the control. (C) Western blots performed after osteoblast cells were cultured with various concentrations (0, 10, 50, 100, 200 µg/ml) of CoPs for 24 h. (D) Flow cytometry analysis of ANXA5 and propidium iodide staining of osteoblast cells cultured with various concentrations (0, 1, 10 mM) of 3-MA, siCtrl and siAtg5 prior to being treated with 50 µg/ml of CoPs for 24 h. (E, G) Quantification analysis of apoptotic cells in (D) (both upper- and lower-right quadrants in representative dot plots as shown). Data are presented as means ± S.D. from 3 independent experiments. *, P < 0.05 and **, P < 0.01 vs. control; ##, P < 0.01 vs. CoPs group. (F) Western blots performed after osteoblast cells were cultured in siCtrl or siAtg5 prior to treatment with CoPs (50 µg/ml) for 24 h. c-CASP3, cleaved CASP3; siCtrl, siControl.
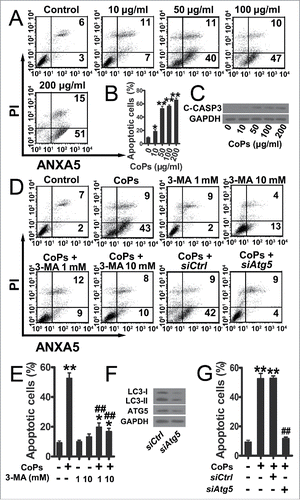
Figure 3. Autophagy mediated the increase in osteoblast apoptosis induced by CoPs. (A) Flow cytometry analysis of ANXA5 and propidium iodide staining of osteoblast cells cultured with various concentrations (0, 10, 50, 100, 200 µg/ml) of CoPs for 24 h. (B) Quantification analysis of apoptotic cells in (A) (both upper- and lower-right quadrants in representative dot plots as shown). Data are represented as means ± S.D. from 3 independent experiments. *, P < 0.05 and **, P < 0.01 vs. the control. (C) Western blots performed after osteoblast cells were cultured with various concentrations (0, 10, 50, 100, 200 µg/ml) of CoPs for 24 h. (D) Flow cytometry analysis of ANXA5 and propidium iodide staining of osteoblast cells cultured with various concentrations (0, 1, 10 mM) of 3-MA, siCtrl and siAtg5 prior to being treated with 50 µg/ml of CoPs for 24 h. (E, G) Quantification analysis of apoptotic cells in (D) (both upper- and lower-right quadrants in representative dot plots as shown). Data are presented as means ± S.D. from 3 independent experiments. *, P < 0.05 and **, P < 0.01 vs. control; ##, P < 0.01 vs. CoPs group. (F) Western blots performed after osteoblast cells were cultured in siCtrl or siAtg5 prior to treatment with CoPs (50 µg/ml) for 24 h. c-CASP3, cleaved CASP3; siCtrl, siControl.
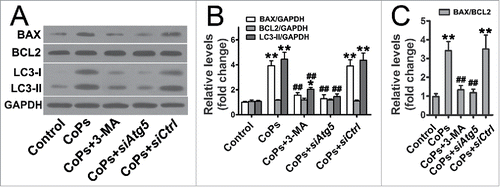
Figure 4. Autophagy mediated the upregulation of BAX induced by CoPs. (A) Western blots performed after osteoblast cells were incubated with 3-MA (10 mM), siAtg5 and siCtrl before being stimulated with CoPs (50 µg/ml) for 24 h. (B, C) The density of the western blots bands shown in (A) was quantified using ImageJ software. siCtrl, siControl. Data are presented as means ± S.E.M. from 3 independent experiments. *, P < 0.05 and **, P < 0.01 vs. control; ##, P < 0.01 vs. CoPs group.

Figure 4. Autophagy mediated the upregulation of BAX induced by CoPs. (A) Western blots performed after osteoblast cells were incubated with 3-MA (10 mM), siAtg5 and siCtrl before being stimulated with CoPs (50 µg/ml) for 24 h. (B, C) The density of the western blots bands shown in (A) was quantified using ImageJ software. siCtrl, siControl. Data are presented as means ± S.E.M. from 3 independent experiments. *, P < 0.05 and **, P < 0.01 vs. control; ##, P < 0.01 vs. CoPs group.

Figure 5. The autophagy inhibitor 3-MA rescued osteoblast numbers and functional disturbance induced by CoPs. (A) Representative HE staining images of calvaria from each group. Osteoblasts are indicated by black arrowheads. Scale bar: 100 µm. EO, endosteum; PO, periosteum. (B) Osteoblast numbers/bone perimeter (mm−1) of endosteum and periosteum in (A). (C) Representative images of new bone formation of calvaria sections from each group were determined by calcein double labeling. Scale bar: 100 µm. (D) P-MAR and E-MAR in (C). (E) Real-time PCR of Alp, Ibsp, Col1a2 and Bglap3 of calvarial bone extracts from each group. Values are expressed as means ± S.E.M. n = 7 mice per group. *P < 0.05, **P < 0.01 vs. sham; #P < 0.05 vs. CoPs group.
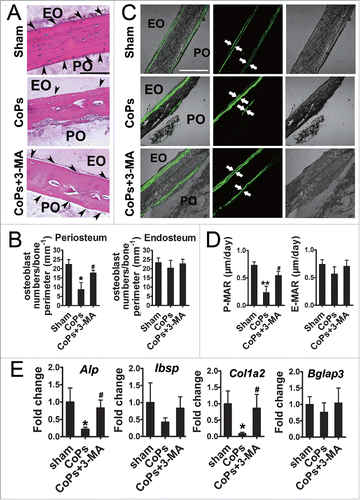
Figure 5. The autophagy inhibitor 3-MA rescued osteoblast numbers and functional disturbance induced by CoPs. (A) Representative HE staining images of calvaria from each group. Osteoblasts are indicated by black arrowheads. Scale bar: 100 µm. EO, endosteum; PO, periosteum. (B) Osteoblast numbers/bone perimeter (mm−1) of endosteum and periosteum in (A). (C) Representative images of new bone formation of calvaria sections from each group were determined by calcein double labeling. Scale bar: 100 µm. (D) P-MAR and E-MAR in (C). (E) Real-time PCR of Alp, Ibsp, Col1a2 and Bglap3 of calvarial bone extracts from each group. Values are expressed as means ± S.E.M. n = 7 mice per group. *P < 0.05, **P < 0.01 vs. sham; #P < 0.05 vs. CoPs group.

Figure 6. The autophagy inhibitor 3-MA ameliorates CoPs-induced mouse calvarial osteolysis assessed by micro-CT. (A) Representative images of micro-CT with 3-dimensional reconstructed images from each group (left). Cross-sectional views of the reconstructed images were indicated by the white horizontal line in the left panel, and the bone osteolysis sites are indicated by white arrows (right). (B) BV/TV and percentage of total porosity of each sample were measured. Values are expressed as means ± S.E.M. n = 7 mice per group. *, P < 0.05, vs. sham; #, P < 0.05 vs. CoPs group.
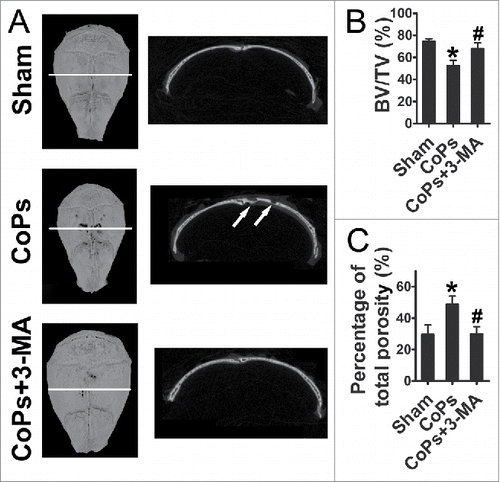
Figure 6. The autophagy inhibitor 3-MA ameliorates CoPs-induced mouse calvarial osteolysis assessed by micro-CT. (A) Representative images of micro-CT with 3-dimensional reconstructed images from each group (left). Cross-sectional views of the reconstructed images were indicated by the white horizontal line in the left panel, and the bone osteolysis sites are indicated by white arrows (right). (B) BV/TV and percentage of total porosity of each sample were measured. Values are expressed as means ± S.E.M. n = 7 mice per group. *, P < 0.05, vs. sham; #, P < 0.05 vs. CoPs group.

Figure 7. Autophagy mediated the upregulation of CoPs-induced osteoblast apoptosis in vivo. (A) Immunofluorescence was performed to determine the expression of cleaved CASP3 in osteoblasts. Sections of murine calvaria are presented for the animals from each group. Scale bar: 50 µm. Red, cleaved CASP3 (C-CASP3); green, osteoblasts (BGLAP); blue, DAPI nuclear staining. (B) Immunofluorescence was performed to determine the colocalization of LC3 and cleaved CASP3 in osteoblasts. Sections of murine calvaria are presented for the animals from each group. Scale bar: 50 µm. Red, LC3; green, cleaved CASP3 (C-CASP3); blue, DAPI nuclear staining.
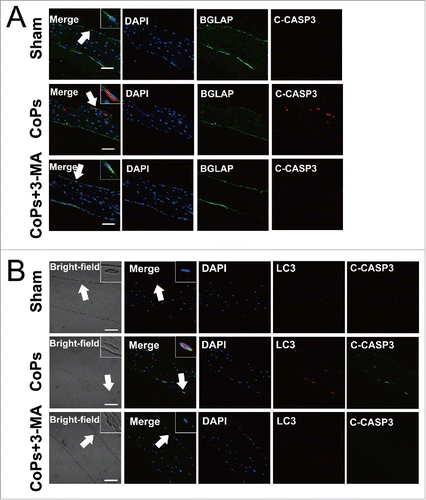
Figure 7. Autophagy mediated the upregulation of CoPs-induced osteoblast apoptosis in vivo. (A) Immunofluorescence was performed to determine the expression of cleaved CASP3 in osteoblasts. Sections of murine calvaria are presented for the animals from each group. Scale bar: 50 µm. Red, cleaved CASP3 (C-CASP3); green, osteoblasts (BGLAP); blue, DAPI nuclear staining. (B) Immunofluorescence was performed to determine the colocalization of LC3 and cleaved CASP3 in osteoblasts. Sections of murine calvaria are presented for the animals from each group. Scale bar: 50 µm. Red, LC3; green, cleaved CASP3 (C-CASP3); blue, DAPI nuclear staining.
Supplemental material

Supplemental_Material.zip

Download Zip (13.5 MB)