2,713
Views
72
CrossRef citations to date
0
Altmetric
Basic Research Paper

Autophagy regulates T lymphocyte proliferation through selective degradation of the cell-cycle inhibitor CDKN1B/p27Kip1

, , , , &
Pages 2335-2345 | Received 27 Jun 2013, Accepted 15 Oct 2015, Published online: 06 Jan 2016

Figures & data

Figure 1. Defective proliferation of Atg7-deficient T cells. Splenocytes from Atg7f/f and Atg7f/fLck-Cre mice were loaded with CFSE and stimulated with coated anti-CD3 mAb (2C11), soluble anti-CD3 plus anti-CD28 (sCD3+CD28) or PMA together with ionomycin for 72 h. The CFSE-diluted cell populations were analyzed by flow cytometry and all cells were gated on 7-AAD negative cells. These experiments were repeated 3 times. (A) Representative flow cytometry profiles of CD4+ or CD8+ T cell proliferation from Atg7-deficient T cells. (B) The percentages of CFSE-diluted CD4+ or CD8+ T cells from Atg7f/f and Atg7f/fLck-Cre mice. Each symbol represents one mouse.
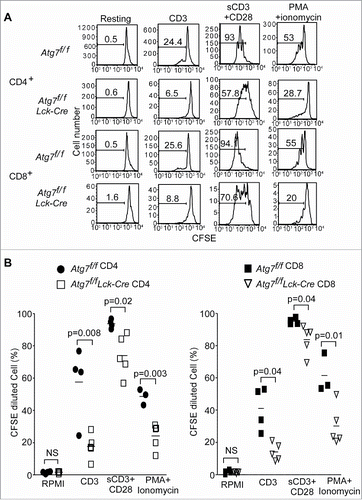
Figure 1. Defective proliferation of Atg7-deficient T cells. Splenocytes from Atg7f/f and Atg7f/fLck-Cre mice were loaded with CFSE and stimulated with coated anti-CD3 mAb (2C11), soluble anti-CD3 plus anti-CD28 (sCD3+CD28) or PMA together with ionomycin for 72 h. The CFSE-diluted cell populations were analyzed by flow cytometry and all cells were gated on 7-AAD negative cells. These experiments were repeated 3 times. (A) Representative flow cytometry profiles of CD4+ or CD8+ T cell proliferation from Atg7-deficient T cells. (B) The percentages of CFSE-diluted CD4+ or CD8+ T cells from Atg7f/f and Atg7f/fLck-Cre mice. Each symbol represents one mouse.

Figure 2. Impaired primary T cell immune response in autophagy-deficient T cells. (A) Analysis of autophagy-deficient T cells in primary response against the infection of L. monocytogens through adoptive transfer assay. One pair of Atg3f/f OT-I and Atg3f/fER-Cre OT-I mice were used to prepare the donor cells. Purified CD8+ cells were transferred to 3-5 PTPRCa/CD45.1 host mice. The blood was withdrawn at d 5 and d 7 after infection, and the frequency of antigen-specific CD8+ T cells was analyzed by gating on the PTPRCb/CD45.2+ CD8+ cells. The experiments were repeated 3 times. (B) The frequencies of antigen-specific CD8+ T cells (PTPRCb/CD45.2+ Dimer X+ CD8+) pooled from 3 mice that received Atg3f/f OT-I and 5 mice that received Atg3f/fER-Cre OT-I cells.
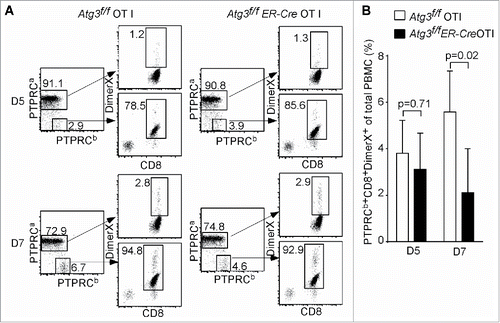
Figure 2. Impaired primary T cell immune response in autophagy-deficient T cells. (A) Analysis of autophagy-deficient T cells in primary response against the infection of L. monocytogens through adoptive transfer assay. One pair of Atg3f/f OT-I and Atg3f/fER-Cre OT-I mice were used to prepare the donor cells. Purified CD8+ cells were transferred to 3-5 PTPRCa/CD45.1 host mice. The blood was withdrawn at d 5 and d 7 after infection, and the frequency of antigen-specific CD8+ T cells was analyzed by gating on the PTPRCb/CD45.2+ CD8+ cells. The experiments were repeated 3 times. (B) The frequencies of antigen-specific CD8+ T cells (PTPRCb/CD45.2+ Dimer X+ CD8+) pooled from 3 mice that received Atg3f/f OT-I and 5 mice that received Atg3f/fER-Cre OT-I cells.

Figure 3. Defective in vivo proliferation of autophagy-deficient T cells. Atg3f/f OT-I and Atg3f/fER-Cre OT-I mice were injected with tamoxifen to induce the deletion of Atg3. Purified CD8+ T cells were loaded with CFSE and then transferred to 3 to 5 normal host mice for each donor cell population intravenously. The next day after transfer, host mice were infected with L. monocytogenes-OVA (1×10⁴cfu/mouse). At 48 h after infection, the splenocytes were harvested. Live, CFSE+ CD8+cells were analyzed for CFSE dilution. This experiment was repeated twice. (A) Representative data of flow cytometry profiles from a pair of mice that received CFSE-labeled Atg3f/fOT-I or Atg3f/fER-CreOT-I T cells are shown. (B) The cell numbers of each generation from 3 pairs of mice that received Atg3f/fOT-I or Atg3f/fER-CreOT-I were analyzed and calculated by Flowjo.
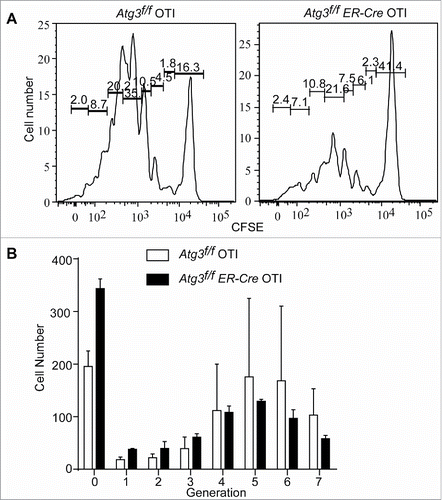
Figure 3. Defective in vivo proliferation of autophagy-deficient T cells. Atg3f/f OT-I and Atg3f/fER-Cre OT-I mice were injected with tamoxifen to induce the deletion of Atg3. Purified CD8+ T cells were loaded with CFSE and then transferred to 3 to 5 normal host mice for each donor cell population intravenously. The next day after transfer, host mice were infected with L. monocytogenes-OVA (1×10⁴cfu/mouse). At 48 h after infection, the splenocytes were harvested. Live, CFSE+ CD8+cells were analyzed for CFSE dilution. This experiment was repeated twice. (A) Representative data of flow cytometry profiles from a pair of mice that received CFSE-labeled Atg3f/fOT-I or Atg3f/fER-CreOT-I T cells are shown. (B) The cell numbers of each generation from 3 pairs of mice that received Atg3f/fOT-I or Atg3f/fER-CreOT-I were analyzed and calculated by Flowjo.

Figure 4. Autophagy-deficient T cells fail to enter into S-phase after TCR stimulation. (A) Splenocytes from Atg3f/f and Atg3f/fLck-Cre mice were stimulated with soluble anti-CD3 plus anti-CD28 antibodies overnight. Cell cycle was analyzed by flow cytometry. The statistical analysis in the lower panel was derived from 3 pairs of Atg3f/f and Atg3f/fLck-Cre mice (mean±SD). The experiment was repeated twice. (B) CDKN1B is accumulated in autophagy-deficient T cells. Atg3f/fOT-I and Atg3f/fER-Cre OT-I mice were inducibly deleted the Atg3 through tamoxifen injection. At d 6 or d 35 after the first injection, the CD8+ T cells were purified and cell lysates were prepared. The expression level of CDKN1B and CDKN1 were analyzed by western blot. The numbers are the ratios of the intensity of target molecule to the loading control ACTB/actin. The normalized intensities from 3 pairs of Atg3f/f OT-I and Atg3f/fER-Cre OT-I mice are shown in the right panel (mean±SD). (C) Impaired degradation of CDKN1B in autophagy-deficient T cells after TCR-mediated activation. Splenocytes were stimulated with anti-CD3 plus anti-CD28 antibodies or without any stimulation overnight. Total T cells were purified and cell lysates were prepared. The expression levels of CDKN1B and CDKN1 were analyzed by western blot. The normalized intensities from 3 pairs of Atg7f/f and Atg7f/f Lck-Cre mice are shown in the lower panel (mean±SD).
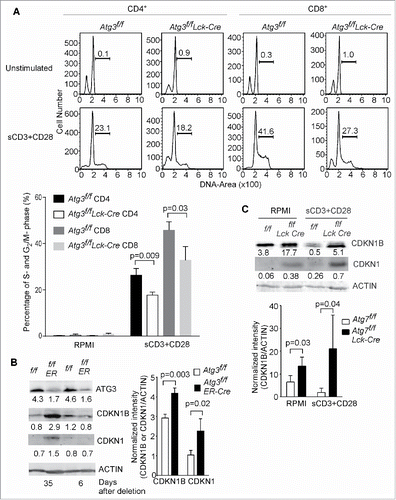
Figure 4. Autophagy-deficient T cells fail to enter into S-phase after TCR stimulation. (A) Splenocytes from Atg3f/f and Atg3f/fLck-Cre mice were stimulated with soluble anti-CD3 plus anti-CD28 antibodies overnight. Cell cycle was analyzed by flow cytometry. The statistical analysis in the lower panel was derived from 3 pairs of Atg3f/f and Atg3f/fLck-Cre mice (mean±SD). The experiment was repeated twice. (B) CDKN1B is accumulated in autophagy-deficient T cells. Atg3f/fOT-I and Atg3f/fER-Cre OT-I mice were inducibly deleted the Atg3 through tamoxifen injection. At d 6 or d 35 after the first injection, the CD8+ T cells were purified and cell lysates were prepared. The expression level of CDKN1B and CDKN1 were analyzed by western blot. The numbers are the ratios of the intensity of target molecule to the loading control ACTB/actin. The normalized intensities from 3 pairs of Atg3f/f OT-I and Atg3f/fER-Cre OT-I mice are shown in the right panel (mean±SD). (C) Impaired degradation of CDKN1B in autophagy-deficient T cells after TCR-mediated activation. Splenocytes were stimulated with anti-CD3 plus anti-CD28 antibodies or without any stimulation overnight. Total T cells were purified and cell lysates were prepared. The expression levels of CDKN1B and CDKN1 were analyzed by western blot. The normalized intensities from 3 pairs of Atg7f/f and Atg7f/f Lck-Cre mice are shown in the lower panel (mean±SD).

Figure 5. Deletion of CDKN1B restores proliferative capacity in autophagy-deficient T cells. (A) Atg3f/f, Atg3f/fER-Cre, Cdkn1b+/-, Atg3f/fER-Cre Cdkn1b+/- and Atg3f/fCdkn1b+/- mice were injected with tamoxifen to inducibly delete Atg3. Splenocytes from Atg3f/f, Atg3f/fER-Cre, Atg3f/fER-Cre Cdkn1b+/- and Atg3f/fCdkn1b+/- mice were isolated, loaded with CFSE, and stimulated with soluble anti-CD3 mAb, or soluble anti-CD3 plus anti-CD28 antibodies for 72 h. Live cells were analyzed for CFSE dilution. All cells were gated on CD4+7-AAD- or CD8+7-AAD- populations. There were 3 or 4 mice in each group in 2 independent experiments. (B) The percentages of CFSE-diluted CD4+ or CD8+ T cells after stimulation with soluble anti-CD3 plus anti-CD28 were analyzed (n=3 or 4). (C) The expression levels of CDKN1B in purified T cells from the above mice by western blot. ACTB/actin serves as loading control. The numbers are normalized expression levels for CDKN1B.
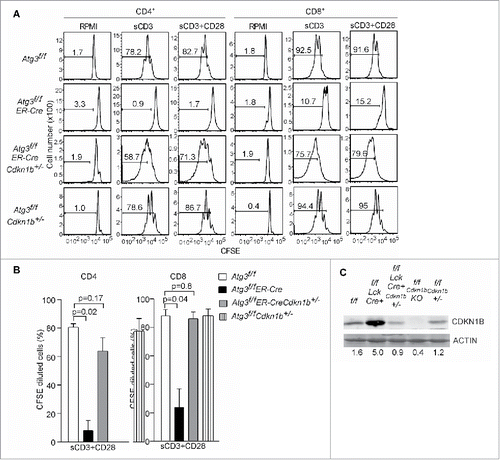
Figure 5. Deletion of CDKN1B restores proliferative capacity in autophagy-deficient T cells. (A) Atg3f/f, Atg3f/fER-Cre, Cdkn1b+/-, Atg3f/fER-Cre Cdkn1b+/- and Atg3f/fCdkn1b+/- mice were injected with tamoxifen to inducibly delete Atg3. Splenocytes from Atg3f/f, Atg3f/fER-Cre, Atg3f/fER-Cre Cdkn1b+/- and Atg3f/fCdkn1b+/- mice were isolated, loaded with CFSE, and stimulated with soluble anti-CD3 mAb, or soluble anti-CD3 plus anti-CD28 antibodies for 72 h. Live cells were analyzed for CFSE dilution. All cells were gated on CD4+7-AAD- or CD8+7-AAD- populations. There were 3 or 4 mice in each group in 2 independent experiments. (B) The percentages of CFSE-diluted CD4+ or CD8+ T cells after stimulation with soluble anti-CD3 plus anti-CD28 were analyzed (n=3 or 4). (C) The expression levels of CDKN1B in purified T cells from the above mice by western blot. ACTB/actin serves as loading control. The numbers are normalized expression levels for CDKN1B.

Figure 6. Autophagy selectively degrades CDKN1B in T lymphocytes. (A) CDKN1B forms polymers naturally. Cell lysates of purified T cell from wild-type mice were prepared. The cell lysates were mixed with reducing sample buffer, which contains 2-ME or nonreducing sample buffer without any 2-ME. The western blot was probed with anti-CDKN1B antibody. (B) CDKN1B interacts with SQSTM1. 293T cells were cotransfected with Sqstm1-HA and Cdkn1b-FLAG constructs. Then tagged proteins were immunoprecipitated with an anti-FLAG antibody and probed with an anti-HA antibody (upper panel). The interaction between endogenous of CDKN1B and SQSTM1 is shown in the lower panel. Atg3f/f and Atg3f/fER-Cre mice were injected with tamoxifen to delete Atg3. Splenocytes from Atg3f/f and Atg3f/fER-Cre mice were isolated and cell lysates were prepared. CDKN1B was immunoprecipitated with anti-CDKN1B antibody and probed for SQSTM1 interaction. (C) Ubiquitination of CDKN1B in splenic T cells. Splenocytes from normal mice were stimulated with soluble anti-CD3 plus anti-CD28 antibodies for 6 h. Then CDKN1B was immunoprecipitated with anti-CDKN1B mAb and the western blot membrane was probed with an anti-ubiquitin antibody. (D) CDKN1B localized in the same autophagy-related membrane structures as that of LC3-II and SQSTM1. Splenocytes from 3 normal mice were stimulated with anti-CD3 antibody in RPMI with choloroquine (50 µg/ml) for 6 h. The homogenates were prepared with protease inhibitors and choloroquine (50 µg/ml) using Dounce homogenizers. Postnuclear subcellular compartments were added into ultracentrifuge tubes on the top of prepared gradients. The distributions of target molecules in each fraction were detected by western blot in reducing condition. The arrow represents the concentration of the gradients from lower to higher densities. P, cell pellet; L, cell lysate. (E) The degradation of CDKN1B was analyzed in the presence of lactacystin or bafilomycin A1 treatment. Splenocytes from normal mice were stimulated with soluble anti-CD3 plus anti-CD28 antibodies with or without lactacystin or bafilomycin A1 treatment. The cells were collected at different time points and the T cells were purified. The expression levels of CDKN1B in T cells were analyzed by western blot.
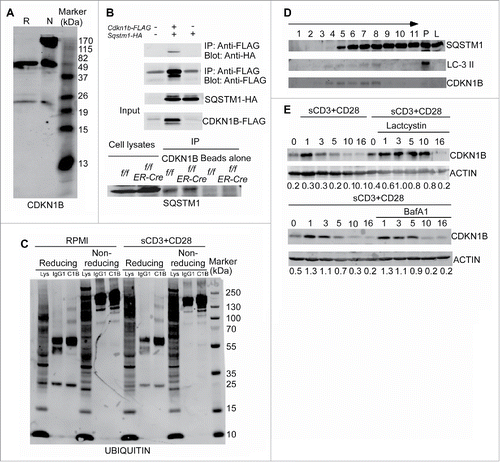
Figure 6. Autophagy selectively degrades CDKN1B in T lymphocytes. (A) CDKN1B forms polymers naturally. Cell lysates of purified T cell from wild-type mice were prepared. The cell lysates were mixed with reducing sample buffer, which contains 2-ME or nonreducing sample buffer without any 2-ME. The western blot was probed with anti-CDKN1B antibody. (B) CDKN1B interacts with SQSTM1. 293T cells were cotransfected with Sqstm1-HA and Cdkn1b-FLAG constructs. Then tagged proteins were immunoprecipitated with an anti-FLAG antibody and probed with an anti-HA antibody (upper panel). The interaction between endogenous of CDKN1B and SQSTM1 is shown in the lower panel. Atg3f/f and Atg3f/fER-Cre mice were injected with tamoxifen to delete Atg3. Splenocytes from Atg3f/f and Atg3f/fER-Cre mice were isolated and cell lysates were prepared. CDKN1B was immunoprecipitated with anti-CDKN1B antibody and probed for SQSTM1 interaction. (C) Ubiquitination of CDKN1B in splenic T cells. Splenocytes from normal mice were stimulated with soluble anti-CD3 plus anti-CD28 antibodies for 6 h. Then CDKN1B was immunoprecipitated with anti-CDKN1B mAb and the western blot membrane was probed with an anti-ubiquitin antibody. (D) CDKN1B localized in the same autophagy-related membrane structures as that of LC3-II and SQSTM1. Splenocytes from 3 normal mice were stimulated with anti-CD3 antibody in RPMI with choloroquine (50 µg/ml) for 6 h. The homogenates were prepared with protease inhibitors and choloroquine (50 µg/ml) using Dounce homogenizers. Postnuclear subcellular compartments were added into ultracentrifuge tubes on the top of prepared gradients. The distributions of target molecules in each fraction were detected by western blot in reducing condition. The arrow represents the concentration of the gradients from lower to higher densities. P, cell pellet; L, cell lysate. (E) The degradation of CDKN1B was analyzed in the presence of lactacystin or bafilomycin A1 treatment. Splenocytes from normal mice were stimulated with soluble anti-CD3 plus anti-CD28 antibodies with or without lactacystin or bafilomycin A1 treatment. The cells were collected at different time points and the T cells were purified. The expression levels of CDKN1B in T cells were analyzed by western blot.
Supplemental material

Supplemental.docx

Download MS Word (1 MB)

Reprints and Corporate Permissions

Please note: Selecting permissions does not provide access to the full text of the article, please see our help page How do I view content?

To request a reprint or corporate permissions for this article, please click on the relevant link below:

Academic Permissions

Please note: Selecting permissions does not provide access to the full text of the article, please see our help page How do I view content?

Obtain permissions instantly via Rightslink by clicking on the button below:

If you are unable to obtain permissions via Rightslink, please complete and submit this Permissions form. For more information, please visit our Permissions help page.