2,973
Views
45
CrossRef citations to date
0
Altmetric
Resource

Identification of modulators of autophagic flux in an image-based high content siRNA screen

, , , , , , , & show all
Pages 713-726 | Received 08 Jun 2015, Accepted 23 Jan 2016, Published online: 06 Apr 2016

Figures & data

Figure 1. Screen flow scheme. Twelve thousand thirty seven genes were first screened in a GFP-SQSTM1 and LAMP2 assay in U2OS for phenotypes consistent with upregulation of autophagy. Four to 8 siRNAs were screened per gene in the primary screen; 617 genes were selected for follow-up and screened with 6 new siRNA per gene, with a concerted effort to avoid seeds biased toward off-target effects by applying common seed analysis to primary screen data. Follow-up assays included hit confirmation in the GFP-SQSTM1 and LAMP2 assay, viability assessment, and MTOR profiling, all in both U2OS and H4 cell lines. Based on these data, 96 genes were selected for confirmation assays, which included a live-cell, kinetic autophagic flux assay; 80 of these 96 genes were selected for siRNA knockdown confirmation via qPCR. Ten hits were ultimately identified; knockdown of these targets resulted in phenotypic profiles consistent with upregulation of autophagic flux. Assay details, including primary output measurements, can be found in .
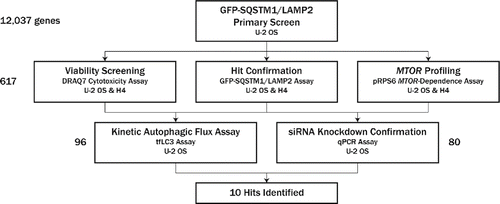
Figure 1. Screen flow scheme. Twelve thousand thirty seven genes were first screened in a GFP-SQSTM1 and LAMP2 assay in U2OS for phenotypes consistent with upregulation of autophagy. Four to 8 siRNAs were screened per gene in the primary screen; 617 genes were selected for follow-up and screened with 6 new siRNA per gene, with a concerted effort to avoid seeds biased toward off-target effects by applying common seed analysis to primary screen data. Follow-up assays included hit confirmation in the GFP-SQSTM1 and LAMP2 assay, viability assessment, and MTOR profiling, all in both U2OS and H4 cell lines. Based on these data, 96 genes were selected for confirmation assays, which included a live-cell, kinetic autophagic flux assay; 80 of these 96 genes were selected for siRNA knockdown confirmation via qPCR. Ten hits were ultimately identified; knockdown of these targets resulted in phenotypic profiles consistent with upregulation of autophagic flux. Assay details, including primary output measurements, can be found in Table 1.

Table 1. Assays used throughout siRNA screening campaign.

Figure 2. Review of primary screen. (A) U2OS cells expressing GFP-SQSTM1 (green, top right) were siRNA-transfected for 96 h and subsequently fixed and stained for nuclear DNA (blue, top left), TUBB (red, bottom left), and LAMP2 (orange, bottom right). Hoechst and TUBB channels were used for segmentation of nuclei and cell boundaries, respectively. (B) GFP-SQSTM1 localizes to the cytoplasm and autophagic puncta. Upon MTOR knockdown (right), autophagy is upregulated, GFP-SQSTM1 is degraded, and cytoplasmic intensity decreases. Degradation of GFP-SQSTM1 was quantified by measuring GFP-SQSTM1 intensity in a 10-pixel wide ring around the nucleus. (C) LAMP2 was stained to identify lysosomes, and cytoplasmic colocalization of GFP-SQSTM1 and LAMP2 was quantified using the Pearson correlation coefficient, r. Knockdown of LAMP2 (right) decreases colocalization relative to nontargeting controls (center), while ATP6V0D1 knockdown (left) attenuates lysosomal acidification and thus increases colocalization. (D) U2OS cells were transfected with 4 to 8 siRNA per gene, and each siRNA's effect on GFP-SQSTM1 mean ring intensity and GFP-SQSTM1 and LAMP2 colocalization was quantified and normalized to nontargeting controls. Individual siRNA results are plotted as percent of control (POC) with positive MTOR control siRNA (red, pink) and neutral control siRNA (blue, light blue) overlaid. Cell count results are reflected in the size of each data point, with higher cell counts represented with larger circles. (E) For each phenotype measured, siRNA POC values were condensed to gene-level P values using a rank-based orthogonal gene averaging (OGA) algorithm. GFP-SQSTM1 and LAMP2 colocalization POC values are plotted on a Kaplan-Meier-like survival plot for LAMP2 (green) and ATP6V0D1 (red) relative to a reference population (black). (F) At the gene level, GFP-SQSTM1 and LAMP2 colocalization uphit P values are plotted against GFP-SQSTM1 mean ring intensity downhit P values. While MTOR and ATP6V0D1 show significant colocalization uphit P values, their autophagy-promoting and autophagy-blocking phenotypes, respectively, are distinguished by their GFP-SQSTM1 mean ring intensity downhit P values. (G) At the gene level, GFP-SQSTM1 and LAMP2 colocalization downhit P values are plotted against GFP-SQSTM1 mean ring intensity downhit P values. While several essential autophagy genes (ATG5, BECN1, PIK3R4, PIK3C3) show significant colocalization downhit P values, these phenotypes are associated with nonsignificant GFP-SQSTM1 mean ring intensity downhit P values.
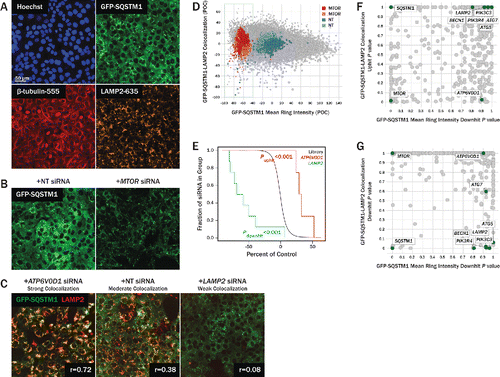
Figure 2. Review of primary screen. (A) U2OS cells expressing GFP-SQSTM1 (green, top right) were siRNA-transfected for 96 h and subsequently fixed and stained for nuclear DNA (blue, top left), TUBB (red, bottom left), and LAMP2 (orange, bottom right). Hoechst and TUBB channels were used for segmentation of nuclei and cell boundaries, respectively. (B) GFP-SQSTM1 localizes to the cytoplasm and autophagic puncta. Upon MTOR knockdown (right), autophagy is upregulated, GFP-SQSTM1 is degraded, and cytoplasmic intensity decreases. Degradation of GFP-SQSTM1 was quantified by measuring GFP-SQSTM1 intensity in a 10-pixel wide ring around the nucleus. (C) LAMP2 was stained to identify lysosomes, and cytoplasmic colocalization of GFP-SQSTM1 and LAMP2 was quantified using the Pearson correlation coefficient, r. Knockdown of LAMP2 (right) decreases colocalization relative to nontargeting controls (center), while ATP6V0D1 knockdown (left) attenuates lysosomal acidification and thus increases colocalization. (D) U2OS cells were transfected with 4 to 8 siRNA per gene, and each siRNA's effect on GFP-SQSTM1 mean ring intensity and GFP-SQSTM1 and LAMP2 colocalization was quantified and normalized to nontargeting controls. Individual siRNA results are plotted as percent of control (POC) with positive MTOR control siRNA (red, pink) and neutral control siRNA (blue, light blue) overlaid. Cell count results are reflected in the size of each data point, with higher cell counts represented with larger circles. (E) For each phenotype measured, siRNA POC values were condensed to gene-level P values using a rank-based orthogonal gene averaging (OGA) algorithm. GFP-SQSTM1 and LAMP2 colocalization POC values are plotted on a Kaplan-Meier-like survival plot for LAMP2 (green) and ATP6V0D1 (red) relative to a reference population (black). (F) At the gene level, GFP-SQSTM1 and LAMP2 colocalization uphit P values are plotted against GFP-SQSTM1 mean ring intensity downhit P values. While MTOR and ATP6V0D1 show significant colocalization uphit P values, their autophagy-promoting and autophagy-blocking phenotypes, respectively, are distinguished by their GFP-SQSTM1 mean ring intensity downhit P values. (G) At the gene level, GFP-SQSTM1 and LAMP2 colocalization downhit P values are plotted against GFP-SQSTM1 mean ring intensity downhit P values. While several essential autophagy genes (ATG5, BECN1, PIK3R4, PIK3C3) show significant colocalization downhit P values, these phenotypes are associated with nonsignificant GFP-SQSTM1 mean ring intensity downhit P values.

Figure 3. Secondary imaging assay to assess cell viability. (A) DRAQ7, a fluorescent DNA dye that only stains nuclei in dead and permeabilized cells, was used to assess the effect of protein knockdown on cell viability. U2OS cells transfected with nontargeting siRNA (left) show a low percentage of DRAQ7+ cells (red), while cells transfected with siRNA targeting the essential gene EIF4A3 both decrease in count and in viability (right). (B) Gene-level hits from the primary screen were profiled in a DRAQ7 viability assay. Where possible, new sequences were used for each gene to avoid biased seeds identified in common seed analysis. Viability was assessed in both U2OS (shown here) and H4 (not shown) cells. For each siRNA tested, the percentage of live cells (Hoechst+ DRAQ7) is plotted against the total cell count (Hoechst+). Nontargeting siRNA (blue, light blue) had little effect on cell viability. Upon MTOR knockdown (red, pink), wells maintained a high percentage of live cells, but did, however, contain fewer cells relative to nontargeting siRNA, suggesting a reduction in cell proliferation in this condition. Knockdown of essential genes POLR2A (green) and EIF4A3 (purple) reduced both cell count and the percentage of live cells, as expected.
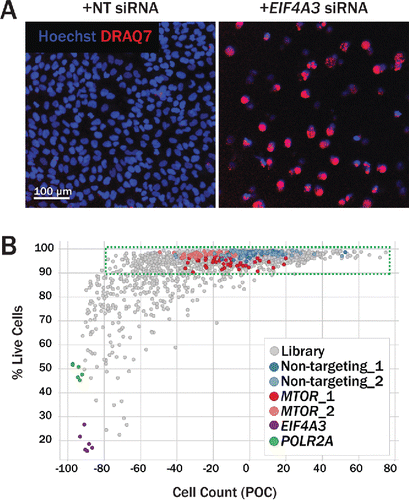
Figure 3. Secondary imaging assay to assess cell viability. (A) DRAQ7, a fluorescent DNA dye that only stains nuclei in dead and permeabilized cells, was used to assess the effect of protein knockdown on cell viability. U2OS cells transfected with nontargeting siRNA (left) show a low percentage of DRAQ7+ cells (red), while cells transfected with siRNA targeting the essential gene EIF4A3 both decrease in count and in viability (right). (B) Gene-level hits from the primary screen were profiled in a DRAQ7 viability assay. Where possible, new sequences were used for each gene to avoid biased seeds identified in common seed analysis. Viability was assessed in both U2OS (shown here) and H4 (not shown) cells. For each siRNA tested, the percentage of live cells (Hoechst+ DRAQ7−) is plotted against the total cell count (Hoechst+). Nontargeting siRNA (blue, light blue) had little effect on cell viability. Upon MTOR knockdown (red, pink), wells maintained a high percentage of live cells, but did, however, contain fewer cells relative to nontargeting siRNA, suggesting a reduction in cell proliferation in this condition. Knockdown of essential genes POLR2A (green) and EIF4A3 (purple) reduced both cell count and the percentage of live cells, as expected.

Figure 4. Secondary imaging assay for assessment of MTOR activity. (A) RPS6/S6, is an indirect substrate of MTORC1 and is phosphorylated by RPS6KB. Relative to siRNA transfection with neutral control siRNA (left), MTOR knockdown (right) significantly reduced the intensity of pRPS6, labeled with anti-pRPS6–555 (red). (B) The pRPS6 readout was multiplexed with the primary GFP-SQSTM1 assay, allowing simultaneous measurement of pRPS6 and GFP-SQSTM1 intensities. Upon MTOR knockdown (red, pink), both pRPS6 and GFP-SQSTM1 intensities were dramatically reduced relative to nontargeting controls (blue, light blue). Several siRNAs in the upper left quadrant decreased GFP-SQSTM1 intensity while maintaining high pRPS6 intensity, suggesting an increase in autophagy independent of MTOR inhibition. (C) Genes with U2OS GFP-SQSTM1 mean ring intensity OGA P values < 0.05 and pRPS6 mean ring intensity OGA P values > 0.25 are listed in the table. Knockdown of these genes resulted in an upregulation of autophagy while pRPS6 levels were not significantly reduced.
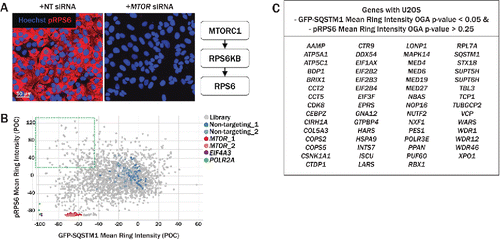
Figure 4. Secondary imaging assay for assessment of MTOR activity. (A) RPS6/S6, is an indirect substrate of MTORC1 and is phosphorylated by RPS6KB. Relative to siRNA transfection with neutral control siRNA (left), MTOR knockdown (right) significantly reduced the intensity of pRPS6, labeled with anti-pRPS6–555 (red). (B) The pRPS6 readout was multiplexed with the primary GFP-SQSTM1 assay, allowing simultaneous measurement of pRPS6 and GFP-SQSTM1 intensities. Upon MTOR knockdown (red, pink), both pRPS6 and GFP-SQSTM1 intensities were dramatically reduced relative to nontargeting controls (blue, light blue). Several siRNAs in the upper left quadrant decreased GFP-SQSTM1 intensity while maintaining high pRPS6 intensity, suggesting an increase in autophagy independent of MTOR inhibition. (C) Genes with U2OS GFP-SQSTM1 mean ring intensity OGA P values < 0.05 and pRPS6 mean ring intensity OGA P values > 0.25 are listed in the table. Knockdown of these genes resulted in an upregulation of autophagy while pRPS6 levels were not significantly reduced.

Figure 5. Tandem-fluorescent LC3 assay to measure autophagic flux over time in live cells. (A) Tandem-fluorescent LC3 (tfLC3) construct consists of tagRFP and tagGFP2 fused to the N terminus of human LC3B. tagRFP pKa = 3.8, while tagGFP2 pKa = 5.0, rendering tagRFP more acid-stable than tagGFP2. Cytosolic RFP-GFP-LC3 is lipidated and translocated to a phagophore (right, GFP+ RFP+ autophagosome). Once an autophagosome has fused with an acidic lysosome, the GFP signal is quenched due to its higher pKa, leaving red-only puncta (left, GFP RFP+ autolysosome). (B) Merged RFP and GFP channels are shown at 50 h (top) and 80 h (bottom) post-transfection for U2OS cells. Relative to nontargeting controls (left), MTOR knockdown (right), increased the number of GFP RFP+ puncta, representing autolysosomes, in the cytoplasm, indicating an upregulation of autophagic activity. (C) U2OS cells stably expressing tfLC3 were siRNA-transfected and imaged live for 66 h following a 26 h incubation period post transfection. GFP RFP+ puncta were identified as autolysosomes and normalized to cell area to quantify autophagic flux over time. siRNA-level results were condensed to gene-level results by aggregating with median values. MTOR knockdown (red) increased autolysosomes/cell area over time relative to nontargeting controls (blue). Several pathway controls, including ATG5 (orange), PIK3C3 (yellow), and BECN1 (green), decreased autophagic flux over time.
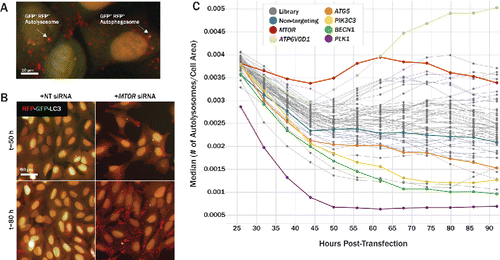
Figure 5. Tandem-fluorescent LC3 assay to measure autophagic flux over time in live cells. (A) Tandem-fluorescent LC3 (tfLC3) construct consists of tagRFP and tagGFP2 fused to the N terminus of human LC3B. tagRFP pKa = 3.8, while tagGFP2 pKa = 5.0, rendering tagRFP more acid-stable than tagGFP2. Cytosolic RFP-GFP-LC3 is lipidated and translocated to a phagophore (right, GFP+ RFP+ autophagosome). Once an autophagosome has fused with an acidic lysosome, the GFP signal is quenched due to its higher pKa, leaving red-only puncta (left, GFP− RFP+ autolysosome). (B) Merged RFP and GFP channels are shown at 50 h (top) and 80 h (bottom) post-transfection for U2OS cells. Relative to nontargeting controls (left), MTOR knockdown (right), increased the number of GFP− RFP+ puncta, representing autolysosomes, in the cytoplasm, indicating an upregulation of autophagic activity. (C) U2OS cells stably expressing tfLC3 were siRNA-transfected and imaged live for 66 h following a 26 h incubation period post transfection. GFP− RFP+ puncta were identified as autolysosomes and normalized to cell area to quantify autophagic flux over time. siRNA-level results were condensed to gene-level results by aggregating with median values. MTOR knockdown (red) increased autolysosomes/cell area over time relative to nontargeting controls (blue). Several pathway controls, including ATG5 (orange), PIK3C3 (yellow), and BECN1 (green), decreased autophagic flux over time.

Figure 6. Summary of screening results and confirmation of gene knockdown. (A) Summary heatmap (left) showing P values from various assays carried out in the screening campaign. Measurement values for each column are noted in the table (right). Assay results from several control genes are shown at the top of the heatmap, with the top 10 gene hits, based on various criteria across all assays, shown below. Heatmap is colored such that P values consistent with increased autophagic flux and low cytotoxicity are represented in green and the inverse is represented in red. (B) Gene knockdown was determined in U2OS cells via qPCR. Each data point represents an individual siRNA and the extent to which it reduced expression of that particular target. All data has been normalized to endogenous GAPDH reference levels and is reported relative to cells transfected with nontargeting control siRNA. qPCR was performed in triplicate. Circles mark average values for individual siRNA, with error bars representing SD.
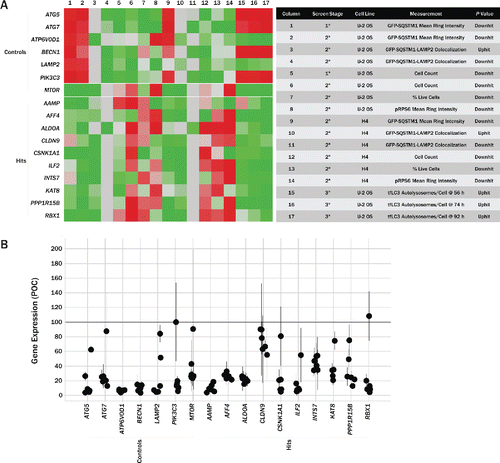
Figure 6. Summary of screening results and confirmation of gene knockdown. (A) Summary heatmap (left) showing P values from various assays carried out in the screening campaign. Measurement values for each column are noted in the table (right). Assay results from several control genes are shown at the top of the heatmap, with the top 10 gene hits, based on various criteria across all assays, shown below. Heatmap is colored such that P values consistent with increased autophagic flux and low cytotoxicity are represented in green and the inverse is represented in red. (B) Gene knockdown was determined in U2OS cells via qPCR. Each data point represents an individual siRNA and the extent to which it reduced expression of that particular target. All data has been normalized to endogenous GAPDH reference levels and is reported relative to cells transfected with nontargeting control siRNA. qPCR was performed in triplicate. Circles mark average values for individual siRNA, with error bars representing SD.

Figure 7. Turnover of long-lived proteins is accelerated in CSNK1A1 knockout cell lines. (A) Immunoblot of CSNK1A1 protein in homogenates from HCT116 parental and HCT116 CSNK1A1 KO clonal lines. A doublet (arrow) corresponding to human isoforms 1 and 2 are absent in the KO cell lines. (B) In a pulse-chase assay, the percent of degraded long-lived protein was significantly higher in HCT116 CSNK1A1 KO lines compared to HCT116 parental cells at 12 h (parental = 9.6 ± 0.1%, KO#12 = 12.3 ± 0.1%, KO#27 = 13.0 ± 0.3%), 24 h (parental = 17.4 ± 0.1%, KO#12 = 21.0 ± 0.3%, KO#27 = 23.0 ± 0.2%), 48 h (parental = 23.9 ± 0.6%, KO#12 = 32.7 ± 0.2%, KO#27 = 33.0 ± 0.2%), and 72 h (parental = 27.0 ± 0.3%, KO#12 = 40.7 ± 0.2%, KO#27 = 39.8 ± 0.2%) after metabolic labeling with 14C-valine (n = 3 wells per condition). Significance was determined by 2-way analysis of variance followed by the Dunnett multiple comparison test (****P < 0.0001). Error bars represent standard error of the mean.
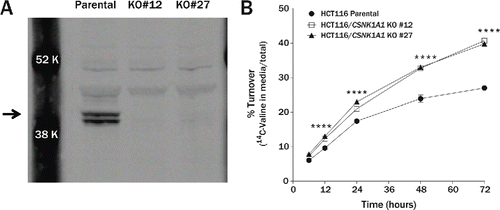
Figure 7. Turnover of long-lived proteins is accelerated in CSNK1A1 knockout cell lines. (A) Immunoblot of CSNK1A1 protein in homogenates from HCT116 parental and HCT116 CSNK1A1 KO clonal lines. A doublet (arrow) corresponding to human isoforms 1 and 2 are absent in the KO cell lines. (B) In a pulse-chase assay, the percent of degraded long-lived protein was significantly higher in HCT116 CSNK1A1 KO lines compared to HCT116 parental cells at 12 h (parental = 9.6 ± 0.1%, KO#12 = 12.3 ± 0.1%, KO#27 = 13.0 ± 0.3%), 24 h (parental = 17.4 ± 0.1%, KO#12 = 21.0 ± 0.3%, KO#27 = 23.0 ± 0.2%), 48 h (parental = 23.9 ± 0.6%, KO#12 = 32.7 ± 0.2%, KO#27 = 33.0 ± 0.2%), and 72 h (parental = 27.0 ± 0.3%, KO#12 = 40.7 ± 0.2%, KO#27 = 39.8 ± 0.2%) after metabolic labeling with 14C-valine (n = 3 wells per condition). Significance was determined by 2-way analysis of variance followed by the Dunnett multiple comparison test (****P < 0.0001). Error bars represent standard error of the mean.

Table 2. Top screen hits and their tfLC3 assay scores.

Supplemental material

Supplementary files

Download Zip (7.3 MB)

Reprints and Corporate Permissions

Please note: Selecting permissions does not provide access to the full text of the article, please see our help page How do I view content?

To request a reprint or corporate permissions for this article, please click on the relevant link below:

Academic Permissions

Please note: Selecting permissions does not provide access to the full text of the article, please see our help page How do I view content?

Obtain permissions instantly via Rightslink by clicking on the button below:

If you are unable to obtain permissions via Rightslink, please complete and submit this Permissions form. For more information, please visit our Permissions help page.