Figures & data
Figure 1. TP53INP2 is localized dynamically to the nucleolus through its C-terminal domain. (A) Colocalization of TP53INP2 with the nucleolar markers. The cells stained with anti-TP53INP2 and anti-POLR1A or anti-TP53INP2 and anti-FBL antibodies, were visualized by confocal microscopy. (B) Analysis of TP53INP2 distribution in subcellular fractions and purified nucleoli of HeLa cells. TUBB, LMNB1 or FBL was used as indicator of the cytosolic, nuclear or nucleolar fraction respectively. (C) HeLa cells transiently expressing GFP-TP53INP2 were imaged before and after photobleaching the indicated nucleolar region (red circle). (D) MCF-7 cells transiently expressing GFP-TP53INP2, GFP-TP53INP2Δ (191 to 212) or GFP-TP53INP2 (191 to 212) were stained with anti-FBL. Scale bars: 10 μm.
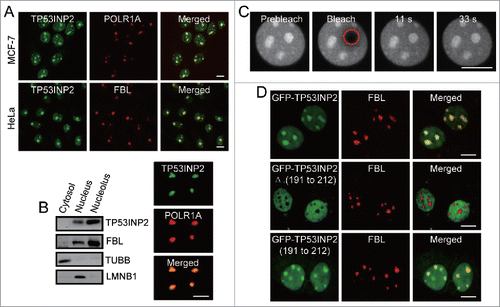
Figure 2. TP53INP2 is required for rDNA transcription. (A) MCF-7 cells treated with 50 ng/ml of actinomycin D for 2 h, were fixed and stained with anti-TP53INP2 and DAPI. (B) HeLa cells treated by TP53INP2 siRNA2 for 24 h were transfected with pCDNA3.1-myc (vector), TP53INP2-MYC (TP53INP2) or TP53INP2ΔNoLS-MYC (TP53INP2ΔNoLS) respectively. After 24 h, cellular 47S rRNA level was measured by real-time PCR and normalized to ACTB mRNA. Cells treated with rapamycin (80 nM, 4 h) were used as a positive control. TP53INP2 protein levels in the cells were shown by western blot. (C) MCF-7 cells treated with TP53INP2 siRNAs were incubated with 5-FUrd, fixed and stained with anti-TP53INP2 and anti-BrdU. Arrows indicate TP53INP2 knockdown cells. (D) HeLa cells treated with TP53INP2 siRNA2 for 24 h were transfected with the indicated plasmids. After 24 h, luciferase activity was measured. TP53INP2 protein levels in the cells were shown by western blot. Data are presented as mean ± SEM of triplicate experiments. ***, P< 0.001; **, P < 0.01; NS, not significant. Scale bars: 10 μm.
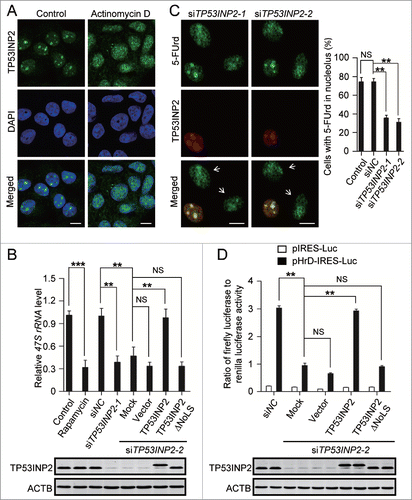
Figure 3. TP53INP2 binds to the rDNA locus. (A) Schematic representation of the human rDNA repeats. The positions of primer pairs (in kb relative to the transcription start site) used in ChIP assays are indicated. (B) ChIP assay of the enrichment of rDNA in TP53INP2 immunoprecipitates. (C) ChIP assay of the enrichment of rDNA in TP53INP2-MYC immunoprecipitates from TP53INP2-MYC-expressing HeLa cells. The occupancy of TP53INP2 on the promoter region of interleukin 2 (IL2) was used as a negative control. Data are presented as mean ± SEM of triplicate experiments.
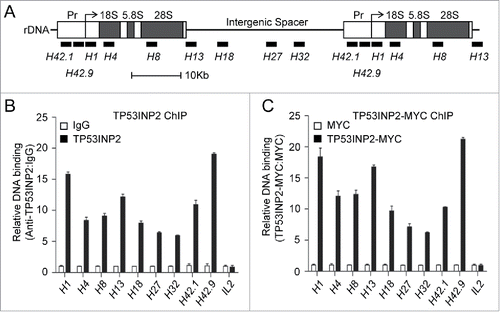
Figure 4. TP53INP2 is required for the recruitment of the POLR1 machinery to rDNA. (A to D) Association of rDNA with UBTF (A), POLR1A (B), TAF1A-MYC (C) or Flag-RRN3 (D) was analyzed by ChIP assay in HeLa cells treated with TP53INP2 siRNA1. The percentage of precipitated DNA was calculated relative to the ChIP input DNA. (E) Normalized quantification of the data from (A to D). (F) HeLa cells treated with TP53INP2 siRNA2 for 24 h were transfected with TP53INP2-MYC or TP53INP2ΔNoLS-MYC. After 24 h, the cells were subjected to ChIP assay using an anti-UBTF or anti-POLR1A antibody. The relative enrichment was determined by real time PCR using primer set H42.9. All data are presented as mean ± SEM of triplicate experiments.
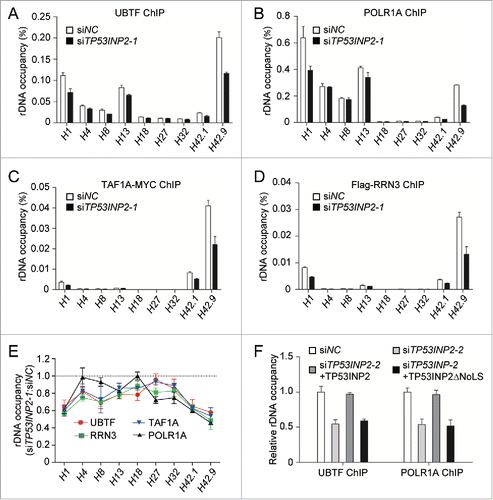
Figure 5. TP53INP2 interacts with POLR1 PIC and is required for the assembly of the complex. (A) Coimmunoprecipitation of UBTF, POLR1A, Flag-RRN3, TAF1A-flag with TP53INP2-MYC in HeLa cells. TP53INP2-MYC was immunoprecipitated with anti-MYC. (B) Cell lysates from HeLa cells expressing Flag-RRN3 and TAF1A-MYC were treated with DNase I (100 units/ml, 10 min), and incubated with purified GST-TP53INP2. POLR1A, Flag-RRN3, TAF1A-MYC or UBTF bound with affinity isolated GST-TP53INP2 was detected by western blot. (C) GST-TP53INP2 pulldown assay in HeLa cells treated with UBTF siRNA for 24 h followed by Flag-RRN3 and TAF1A-MYC transfection. The affinity isolated GST-TP53INP2 is shown. (D) HeLa cells expressing CFP-UBTF and TP53INP2-YFP were imaged before and after photobleaching with a high-intensity 514 nm laser. Note the increased CFP-UBTF signals at the nucleolar region after photobleaching. Changes of CFP and YFP signals within the nucleolus were shown. (E) In vitro binding of TP53INP2 with UBTF. Purified TP53INP2 was incubated with purified GST-UBTF or GST-TAF1A immobilized on glutathione-sepharose beads, and bound TP53INP2 was analyzed by western blot. (F) Gel filtration analysis of the nuclear extract of HeLa cells treated with TP53INP2 siRNAs. The fractions were analyzed by western blot using anti-POLR1A antibody. (G) TP53INP2 siRNA2-treated cells were transfected with Flag-RRN3 and TAF1A-MYC, together with TP53INP2-MYC or TP53INP2ΔNoLS-MYC. After 24 h, the cells were subjected to immunoprecipitation by anti-UBTF, followed by western blot to detect each of the indicated proteins.
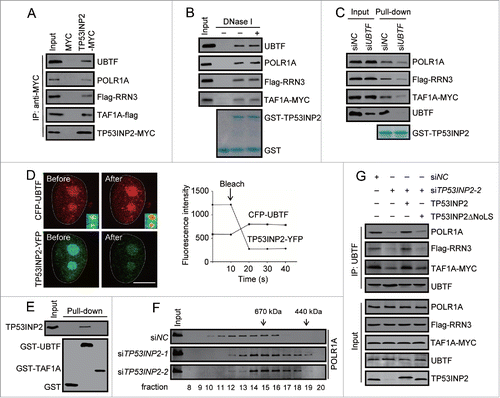
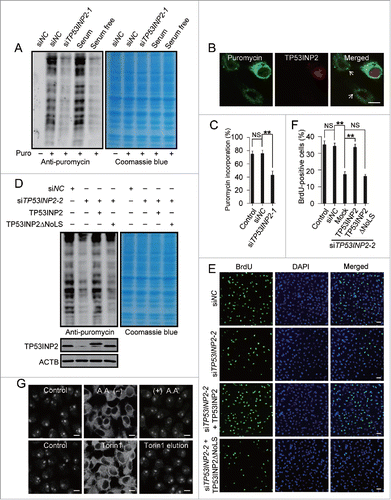
Figure 6. TP53INP2 is required for protein synthesis and cell proliferation. (A) Global protein synthesis detected by SUnSET in HeLa cells. The cells were either cultured with serum-free medium for 12 h or treated with TP53INP2 siRNA1. The specificity of the anti-puromycin antibody was demonstrated by a sample without puromycin incubation. Coomassie blue staining was used as loading control. (B and C) Puromycin incorporation in TP53INP2 siRNA1-treated cells detected by anti-puromycin antibody. Arrows indicate TP53INP2 knockdown cells. Scale bar: 10 μm. (D) HeLa cells treated with TP53INP2 siRNA2 for 24 h were transfected with TP53INP2-MYC or TP53INP2ΔNoLS-MYC. After 24 h, the nascent proteins were analyzed by SUnSET. (E and F) HeLa cells treated with TP53INP2 siRNA2 for 24 h were transfected with TP53INP2-MYC or TP53INP2ΔNoLS-MYC. After 24 h, cells were subjected to BrdU incorporation assay. Scale bar: 50 μm. (G) Intracellular distribution of TP53INP2 in HeLa cells. The cells were either cultured in amino acid-free medium for 3 h with or without replacement to normal medium for 3 h, or treated with 250 nM of Torin1 for 3 h with or without replacement to Torin1-free medium for 3 h. Scale bars: 10 μm. All the quantitative data are presented as mean ± SEM of triplicate experiments. **, P< 0.01; NS, not significant.