2,965
Views
83
CrossRef citations to date
0
Altmetric
Translational Research Paper

Impairment of chaperone-mediated autophagy induces dopaminergic neurodegeneration in rats

, , , , &
Pages 2230-2247 | Received 03 Jan 2016, Accepted 14 Jul 2016, Published online: 01 Nov 2016

Figures & data

Figure 1. Generation and efficient delivery of rAAV-vectors targeting endogenous LAMP2A in the rat nigrostiatal pathway. (A) General rAAV-vector design, with the 2 different LAMP2A-specific targeting sequences (denoted L1 and L2) and the scrambled control sequence (scr), listed in full. (B) Representative western immunoblots for LAMP2A and TUBG (loading control) in PC12 cells transiently transfected with rAAV vectors targeting rat Lamp2a (L1, L2) or with a scrambled sequence (scr) are shown in the left panel and quantification of LAMP2A levels is shown in the right panel, at 48 h post-transfection (***, p < 0.001; n = 3/group, one-way ANOVA). (C) Representative immunohistochemical fluorescence images with TH and GFP antibodies showing the expression of the GFP-tagged rAAV-scr shRNA vector in the TH+ neurons of the substantia nigra pars compacta (SNpc) (upper row) and their TH+ striatal afferents (lower row), 8-wk post-injection. Scale bar: 100 μm for SNpc and 50 μm for striatum.
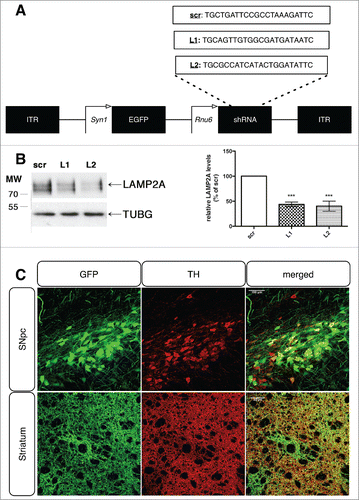
Figure 1. Generation and efficient delivery of rAAV-vectors targeting endogenous LAMP2A in the rat nigrostiatal pathway. (A) General rAAV-vector design, with the 2 different LAMP2A-specific targeting sequences (denoted L1 and L2) and the scrambled control sequence (scr), listed in full. (B) Representative western immunoblots for LAMP2A and TUBG (loading control) in PC12 cells transiently transfected with rAAV vectors targeting rat Lamp2a (L1, L2) or with a scrambled sequence (scr) are shown in the left panel and quantification of LAMP2A levels is shown in the right panel, at 48 h post-transfection (***, p < 0.001; n = 3/group, one-way ANOVA). (C) Representative immunohistochemical fluorescence images with TH and GFP antibodies showing the expression of the GFP-tagged rAAV-scr shRNA vector in the TH+ neurons of the substantia nigra pars compacta (SNpc) (upper row) and their TH+ striatal afferents (lower row), 8-wk post-injection. Scale bar: 100 μm for SNpc and 50 μm for striatum.

Figure 2. rAAVs expressing shRNAs against endogenous rat Lamp2a (L1, L2) efficiently decrease LAMP2A protein levels and impair CMA-function in transduced nigral neurons, while LAMP1 levels remain unaffected. (A) Representative immunofluorescence images depicting the expression of LAMP2A (red) in nigral neurons transduced with the GFP-tagged rAAV-shRNAs (green), 8-wk post-injection. The fourth column shows the red channel masked by the green, illustrating the images used for the automated puncta quantifications. Scale bar: 15 μm. (B) Automated quantifications of LAMP2A+ puncta per GFP+ neuron, expressed as folds of the respective time-point matched control (*, p< 0.05; **, p < 0.01; n = 5 animals/group, one-way ANOVA). (C) Representative immunofluorescence images of LAMP2A (red) and LAMP1 (pseudo color) protein expression in GFP-shRNA-transduced neurons, 8-wk post-injection. Scale bar: 5 μm. (D) Western immunoblots for LAMP2A, LAMP1 and TUBG (loading control) in the contralateral (C) and ipsilateral (I) ventral midbrain of rAAV-shRNA-injected animals are shown in the upper panel and quantifications of LAMP2A and LAMP1 levels are shown in the bottom panel, 8-wk post-injection (*, p < 0.05; n = 5 animals/group, one-way ANOVA). (E) In vitro assay to measure CMA activity by monitoring direct translocation of human recombinant SNCA into lysosomes isolated from the contralateral (C) and ipsilateral (I) ventral midbrain of scr-, L1- and L2-injected animals, 2 wk post-injection. Lysosomes were incubated with recombinant SNCA, in the presence (+) or absence (−) of proteinase inhibitors, collected by centrifugation and subjected to immunoblot analysis for SNCA, LAMP2A, CTSD and TUBG levels. Representative western blots are shown in the left panel and quantification of the relative uptake of recombinant SNCA expressed as percent of SNCA detected in the absence or presence of protease inhibitors is shown in the right panel (*, p < 0.05; ***, p < 0.001; n = 2 with 3 pooled animals/group, one-way ANOVA).
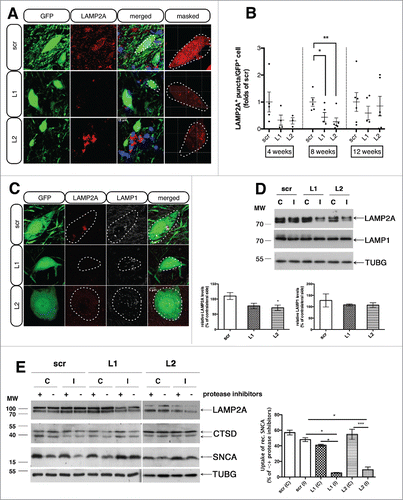
Figure 2. rAAVs expressing shRNAs against endogenous rat Lamp2a (L1, L2) efficiently decrease LAMP2A protein levels and impair CMA-function in transduced nigral neurons, while LAMP1 levels remain unaffected. (A) Representative immunofluorescence images depicting the expression of LAMP2A (red) in nigral neurons transduced with the GFP-tagged rAAV-shRNAs (green), 8-wk post-injection. The fourth column shows the red channel masked by the green, illustrating the images used for the automated puncta quantifications. Scale bar: 15 μm. (B) Automated quantifications of LAMP2A+ puncta per GFP+ neuron, expressed as folds of the respective time-point matched control (*, p< 0.05; **, p < 0.01; n = 5 animals/group, one-way ANOVA). (C) Representative immunofluorescence images of LAMP2A (red) and LAMP1 (pseudo color) protein expression in GFP-shRNA-transduced neurons, 8-wk post-injection. Scale bar: 5 μm. (D) Western immunoblots for LAMP2A, LAMP1 and TUBG (loading control) in the contralateral (C) and ipsilateral (I) ventral midbrain of rAAV-shRNA-injected animals are shown in the upper panel and quantifications of LAMP2A and LAMP1 levels are shown in the bottom panel, 8-wk post-injection (*, p < 0.05; n = 5 animals/group, one-way ANOVA). (E) In vitro assay to measure CMA activity by monitoring direct translocation of human recombinant SNCA into lysosomes isolated from the contralateral (C) and ipsilateral (I) ventral midbrain of scr-, L1- and L2-injected animals, 2 wk post-injection. Lysosomes were incubated with recombinant SNCA, in the presence (+) or absence (−) of proteinase inhibitors, collected by centrifugation and subjected to immunoblot analysis for SNCA, LAMP2A, CTSD and TUBG levels. Representative western blots are shown in the left panel and quantification of the relative uptake of recombinant SNCA expressed as percent of SNCA detected in the absence or presence of protease inhibitors is shown in the right panel (*, p < 0.05; ***, p < 0.001; n = 2 with 3 pooled animals/group, one-way ANOVA).

Figure 3. LAMP2A downregulation results in increased accumulation of UBIQUITIN-positive SNCA puncta within GFP-transduced nigral neurons. (A) Representative immunofluorescence images showing the expression of SNCA (red) and GFP (green) in rAAV-transduced neurons, 8-wk post-injection. The fourth column depicts the masked red channel used for quantifications. Scale bar: 25 μm. (B) Automated quantifications of SNCA+ puncta/GFP+ cell, expressed as folds of the respective time-point matched scrambled condition (*, p < 0.05; n = 6/group, one-way ANOVA). (C) Cross-correlation analysis of SNCA+ puncta/GFP+ cell and LAMP2A+ puncta/GFP+ cell for every animal injected with L1 or L2 rAAVs at all time-points (ρ = 0.36, p = 0.055; n = 28). (D) Representative immunofluorescent images showing SNCA (red) and UBIQUITIN (pseudo color) in GFP-transduced nigral neurons are shown in the left panel and quantification of SNCA-UBIQUITIN colocalization is shown in the right panel (*, p < 0.05; n = 3 animals/group, one-way ANOVA). Scale bar: 5 μm. (E) Representative immunofluorescence images showing Syn303 SNCA (red) in GFP-transduced nigral neurons. Scale bar: 10 μm.
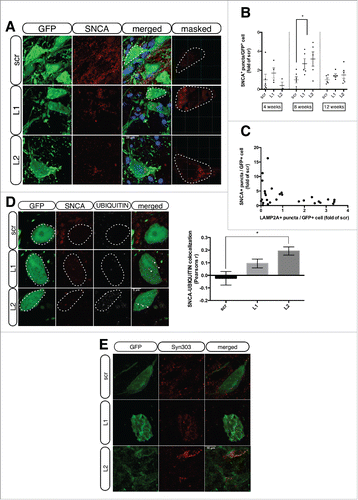
Figure 3. LAMP2A downregulation results in increased accumulation of UBIQUITIN-positive SNCA puncta within GFP-transduced nigral neurons. (A) Representative immunofluorescence images showing the expression of SNCA (red) and GFP (green) in rAAV-transduced neurons, 8-wk post-injection. The fourth column depicts the masked red channel used for quantifications. Scale bar: 25 μm. (B) Automated quantifications of SNCA+ puncta/GFP+ cell, expressed as folds of the respective time-point matched scrambled condition (*, p < 0.05; n = 6/group, one-way ANOVA). (C) Cross-correlation analysis of SNCA+ puncta/GFP+ cell and LAMP2A+ puncta/GFP+ cell for every animal injected with L1 or L2 rAAVs at all time-points (ρ = 0.36, p = 0.055; n = 28). (D) Representative immunofluorescent images showing SNCA (red) and UBIQUITIN (pseudo color) in GFP-transduced nigral neurons are shown in the left panel and quantification of SNCA-UBIQUITIN colocalization is shown in the right panel (*, p < 0.05; n = 3 animals/group, one-way ANOVA). Scale bar: 5 μm. (E) Representative immunofluorescence images showing Syn303 SNCA (red) in GFP-transduced nigral neurons. Scale bar: 10 μm.

Figure 4. CMA deficiency results in accumulation of intracellular SNCA+ immunogold particles and autophagic vacuoles within transduced degenerating nigral neurons. (A) Electron micrographs demonstrating the intracellular distribution of SNCA immunolabeling in SNpc neurons transduced with Lamp2a-shRNA rAAVs. In both L1- and L2-injected animals, SNCA-conjugated silver enhanced immunogold particles (arrows) were found in the cytoplasm (upper row), in close proximity to endoplasmic reticulum (ER), mitochondria (m) and lysosomes (L) (middle and bottom rows). No cytoplasmic SNCA immunolabeling was evident in scr-injected animals, where SNCA was localized mainly in presynaptiC-terminals (S, bottom row). The cytoplasm of LAMP2A-deficient rats was also characterized by the presence of lipofuscin pigments (Lf) and autophagic vacuoles (av). N, nucleus; G, Golgi; mvb, multivesicular bodies; S, synapse; dspine, dendritic spine; Deg. Ax., degrading axon. Scale bars: 0.5 μm (upper row); 0.2 μm (middle row); 0.2 μm (bottom row). (B) Electron micrographs demonstrating the accumulation of numerous autophagosomes (av) with storage material of different nature and also multivesicular bodies (mvb), in degenerating neurites of LAMP2A-deficient rats (L1, L2). In contrast, nigral neurons of control scr-injected rats displayed typical dendrites (D) with intact mitochondria (m) and axonal terminal buttons (At1,2). A cluster of SNCA-conjugated gold/silver particles (arrow) was detectable in neighboring synaptic processes (S) of scr-injected animals, while SNCA-immunolabeling was present in dystrophic neurites in L1- and L2-injected animals (arrows, upper row). Scale bars: 0.2 μm (upper row); 0.1 μm (bottom row).
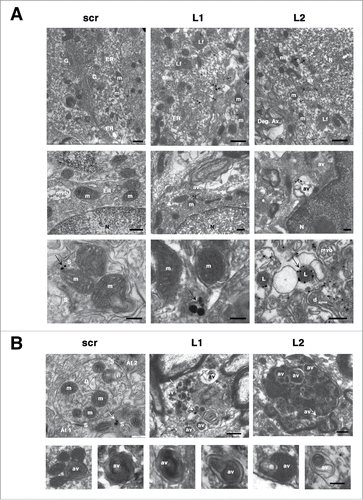
Figure 4. CMA deficiency results in accumulation of intracellular SNCA+ immunogold particles and autophagic vacuoles within transduced degenerating nigral neurons. (A) Electron micrographs demonstrating the intracellular distribution of SNCA immunolabeling in SNpc neurons transduced with Lamp2a-shRNA rAAVs. In both L1- and L2-injected animals, SNCA-conjugated silver enhanced immunogold particles (arrows) were found in the cytoplasm (upper row), in close proximity to endoplasmic reticulum (ER), mitochondria (m) and lysosomes (L) (middle and bottom rows). No cytoplasmic SNCA immunolabeling was evident in scr-injected animals, where SNCA was localized mainly in presynaptiC-terminals (S, bottom row). The cytoplasm of LAMP2A-deficient rats was also characterized by the presence of lipofuscin pigments (Lf) and autophagic vacuoles (av). N, nucleus; G, Golgi; mvb, multivesicular bodies; S, synapse; dspine, dendritic spine; Deg. Ax., degrading axon. Scale bars: 0.5 μm (upper row); 0.2 μm (middle row); 0.2 μm (bottom row). (B) Electron micrographs demonstrating the accumulation of numerous autophagosomes (av) with storage material of different nature and also multivesicular bodies (mvb), in degenerating neurites of LAMP2A-deficient rats (L1, L2). In contrast, nigral neurons of control scr-injected rats displayed typical dendrites (D) with intact mitochondria (m) and axonal terminal buttons (At1,2). A cluster of SNCA-conjugated gold/silver particles (arrow) was detectable in neighboring synaptic processes (S) of scr-injected animals, while SNCA-immunolabeling was present in dystrophic neurites in L1- and L2-injected animals (arrows, upper row). Scale bars: 0.2 μm (upper row); 0.1 μm (bottom row).

Figure 5. LAMP2A downregulation is accompanied by increased LC3 and decreased SQSTM1 levels within transduced nigral neurons. (A) Representative immunofluorescence images depicting LC3 (red) accumulation in GFP-transduced nigral neurons are shown in the left panel and quantification of LC3+ fluorescence/GFP+ cell is shown in the right panel (*, p < 0.05; n = 3 animals/group, one-way ANOVA). Scale bar: 10 μm. (B) Representative immunofluorescence images depicting SQSTM1 (red) reduction in GFP-transduced nigral neurons are shown in the left panel and quantification of SQSTM1+ fluorescence/GFP+ cell is shown in the right panel (p = 0.051; n = 3 animals/group, one-way ANOVA). Scale bar: 15 μm. (C) Western immunoblots for SQSTM1, LC3-I, LC3-II (short and long exposure) and TUBG (loading control) in the contralateral (C) and ipsilateral (I) ventral midbrain of scr, L1 and L2 rAAV-injected animals are shown in the left panels and quantifications of LC3-I, LC3-II and SQSTM1 levels are shown in the right panels, 8-wk post-injection (*, p < 0.05; n = 5 animals/group, one-way ANOVA).
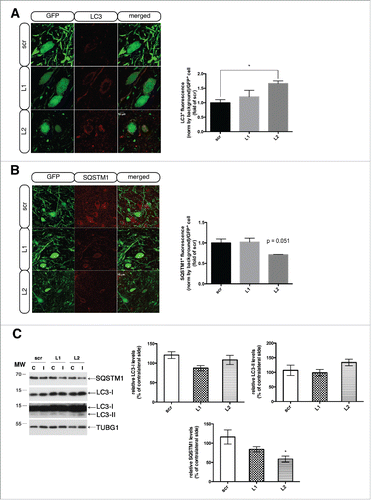
Figure 5. LAMP2A downregulation is accompanied by increased LC3 and decreased SQSTM1 levels within transduced nigral neurons. (A) Representative immunofluorescence images depicting LC3 (red) accumulation in GFP-transduced nigral neurons are shown in the left panel and quantification of LC3+ fluorescence/GFP+ cell is shown in the right panel (*, p < 0.05; n = 3 animals/group, one-way ANOVA). Scale bar: 10 μm. (B) Representative immunofluorescence images depicting SQSTM1 (red) reduction in GFP-transduced nigral neurons are shown in the left panel and quantification of SQSTM1+ fluorescence/GFP+ cell is shown in the right panel (p = 0.051; n = 3 animals/group, one-way ANOVA). Scale bar: 15 μm. (C) Western immunoblots for SQSTM1, LC3-I, LC3-II (short and long exposure) and TUBG (loading control) in the contralateral (C) and ipsilateral (I) ventral midbrain of scr, L1 and L2 rAAV-injected animals are shown in the left panels and quantifications of LC3-I, LC3-II and SQSTM1 levels are shown in the right panels, 8-wk post-injection (*, p < 0.05; n = 5 animals/group, one-way ANOVA).

Figure 6. Selective LAMP2A downregulation causes progressive loss of dopaminergic neurons in the rat substantia nigra. (A) Representative TH-immuno-labeled nigral coronal images of animals injected with sh-scr (top row), sh-Lamp2a L1 (middle row), or sh-Lamp2a L2 (bottom row), across 4-, 8-, and 12-wk post-injection. Scale bar: 1 mm. (B) Stereological quantification of numbers of TH+ neurons in the ipsilateral (I) SNpc as a percent of the contralateral (C) control hemisphere in all animals (**, p < 0.01; ***, p < 0.001; n = 6/group). (C) Cross-correlation analysis of the average number of the LAMP2A+ puncta/GFP+ cell and the percent loss of TH+ neurons in the ipsilateral SNpc relative to the contralateral control side, for every animal injected with L1 or L2 rAAVs across all time points (ρ = −0.40, p = 0.001; n = 27). (D) Correlation analysis of the SNCA+ puncta/GFP+ cell and the percent loss of TH+ neurons relative to the contralateral hemisphere for every animal injected with L1 or L2 rAAVs across all time points (ρ = 0.51, p = 0.004; n = 28). (E) Representative western immunoblots for TH, GFP and TUBG (loading control) in the contralateral (C) and ipsilateral (I) ventral midbrain of scr, L1 and L2 rAAV-injected animals are shown in the upper panels and quantifications of TH and GFP levels are shown in the bottom panels, at 4-, 8- and 12-wk post-injection (*, p < 0.05; **, p < 0.01; n = 5 animals/group, one-way ANOVA).
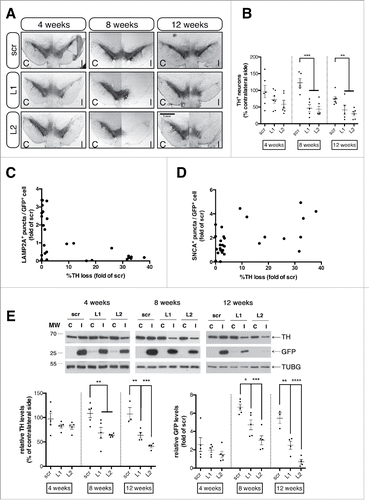
Figure 6. Selective LAMP2A downregulation causes progressive loss of dopaminergic neurons in the rat substantia nigra. (A) Representative TH-immuno-labeled nigral coronal images of animals injected with sh-scr (top row), sh-Lamp2a L1 (middle row), or sh-Lamp2a L2 (bottom row), across 4-, 8-, and 12-wk post-injection. Scale bar: 1 mm. (B) Stereological quantification of numbers of TH+ neurons in the ipsilateral (I) SNpc as a percent of the contralateral (C) control hemisphere in all animals (**, p < 0.01; ***, p < 0.001; n = 6/group). (C) Cross-correlation analysis of the average number of the LAMP2A+ puncta/GFP+ cell and the percent loss of TH+ neurons in the ipsilateral SNpc relative to the contralateral control side, for every animal injected with L1 or L2 rAAVs across all time points (ρ = −0.40, p = 0.001; n = 27). (D) Correlation analysis of the SNCA+ puncta/GFP+ cell and the percent loss of TH+ neurons relative to the contralateral hemisphere for every animal injected with L1 or L2 rAAVs across all time points (ρ = 0.51, p = 0.004; n = 28). (E) Representative western immunoblots for TH, GFP and TUBG (loading control) in the contralateral (C) and ipsilateral (I) ventral midbrain of scr, L1 and L2 rAAV-injected animals are shown in the upper panels and quantifications of TH and GFP levels are shown in the bottom panels, at 4-, 8- and 12-wk post-injection (*, p < 0.05; **, p < 0.01; n = 5 animals/group, one-way ANOVA).
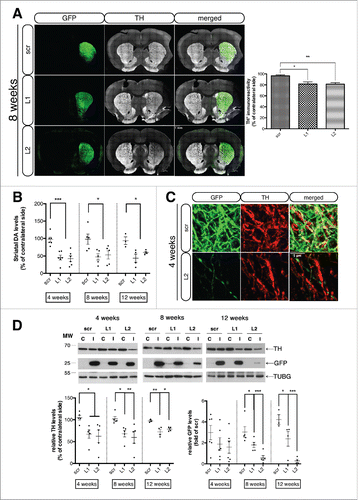
Figure 7. Loss of the nigrostriatal innervation due to CMA blockade precedes nigral cell death. (A) Representative tile scan confocal immunofluorescence visualization of the GFP (green) and TH (pseudo color) expression in striatal sections from all groups, 8-wk post-injection is shown in the left panel and quantification of striatal TH levels expressed as the mean percent of the contralateral hemisphere is shown in the right panel (*, p < 0.05; **, p < 0.01; n = 6 animals/group). In the Lamp2a-shRNA injected animals the GFP signal has been pumped up for visualization purposes, since intensity of the signal was much lower in these animals compared in the scr-injected ones, due to the loss of GFP+ terminals. Scale bar: 1 mm. (B) Quantification of striatal dopamine (DA) levels by high-performance liquid chromatography, expressed as the mean percent of the contralateral hemisphere, at all time points (*, p < 0.05; ***, p < 0.001; n = 6 animals/group). (C) High-power immunofluorescence images of TH expression (red) within GFP-positive striatal terminals of scr- and L2-transduced animals, 8-wk post-injection. Scale bar: 1 μm. (D) Representative western immunoblots for TH, GFP and TUBG (loading control) in the contralateral (C) and ipsilateral (I) striatal tissues of scr, L1 and L2 rAAV-injected animals are shown in the upper panels and quantifications of TH and GFP levels are shown in the bottom panels, at 4-, 8- and 12-wk post-injection (*, p < 0.05; **, p < 0.01; n = 5 animals/group, one-way ANOVA).

Figure 7. Loss of the nigrostriatal innervation due to CMA blockade precedes nigral cell death. (A) Representative tile scan confocal immunofluorescence visualization of the GFP (green) and TH (pseudo color) expression in striatal sections from all groups, 8-wk post-injection is shown in the left panel and quantification of striatal TH levels expressed as the mean percent of the contralateral hemisphere is shown in the right panel (*, p < 0.05; **, p < 0.01; n = 6 animals/group). In the Lamp2a-shRNA injected animals the GFP signal has been pumped up for visualization purposes, since intensity of the signal was much lower in these animals compared in the scr-injected ones, due to the loss of GFP+ terminals. Scale bar: 1 mm. (B) Quantification of striatal dopamine (DA) levels by high-performance liquid chromatography, expressed as the mean percent of the contralateral hemisphere, at all time points (*, p < 0.05; ***, p < 0.001; n = 6 animals/group). (C) High-power immunofluorescence images of TH expression (red) within GFP-positive striatal terminals of scr- and L2-transduced animals, 8-wk post-injection. Scale bar: 1 μm. (D) Representative western immunoblots for TH, GFP and TUBG (loading control) in the contralateral (C) and ipsilateral (I) striatal tissues of scr, L1 and L2 rAAV-injected animals are shown in the upper panels and quantifications of TH and GFP levels are shown in the bottom panels, at 4-, 8- and 12-wk post-injection (*, p < 0.05; **, p < 0.01; n = 5 animals/group, one-way ANOVA).

Figure 8. LAMP2A deficiency is accompanied by robust astro- and microgliosis in transduced nigral neurons. (A) Representative immunofluorescence images of GFAP+ astrocytes (red) in the vicinity of GFP+ nigral neurons of all groups, 8-wk post-injection are shown in the left panel and quantification of GFAP+ contours/μm3 of ventral midbrain tissue is shown in the right panel (*, p < 0.05; n = 3 animals/group, one-way ANOVA). Scale bar: 100 μm. (B) Representative immunofluorescence staining of AIF1+ microglia (red) in the vicinity of GFP+ nigral neurons of all groups, 8-wk post-injection are shown in the left panel and quantification of AIF1+ contours/μm3 of ventral midbrain tissue is shown in the right panel (*, p < 0.05; n = 3 animals/group, one-way ANOVA). Scale bar: 50 μm. The inserts (right) show higher magnification of the indicated region.
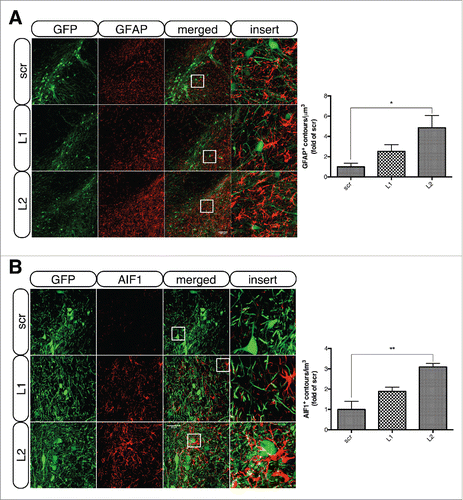
Figure 8. LAMP2A deficiency is accompanied by robust astro- and microgliosis in transduced nigral neurons. (A) Representative immunofluorescence images of GFAP+ astrocytes (red) in the vicinity of GFP+ nigral neurons of all groups, 8-wk post-injection are shown in the left panel and quantification of GFAP+ contours/μm3 of ventral midbrain tissue is shown in the right panel (*, p < 0.05; n = 3 animals/group, one-way ANOVA). Scale bar: 100 μm. (B) Representative immunofluorescence staining of AIF1+ microglia (red) in the vicinity of GFP+ nigral neurons of all groups, 8-wk post-injection are shown in the left panel and quantification of AIF1+ contours/μm3 of ventral midbrain tissue is shown in the right panel (*, p < 0.05; n = 3 animals/group, one-way ANOVA). Scale bar: 50 μm. The inserts (right) show higher magnification of the indicated region.

Figure 9. Deterioration of the dopaminergic system evoked by CMA impairment produces abnormal motor behavioral phenotypes. (A) LAMP2A downregulation with L2-shRNA resulted in increased net d-amphetamine-induced ipsilateral rotations at 8-wk post-injection, with a similar trend at 12 wk, indicating a unilateral motor impairment (*, p < 0.05; n = 22 animals/group for 4 wk, n = 15 animals/group for 8 wk, n = 11 animals/group for 12 wk, one-way ANOVA). (B) Contralateral forelimb use as assessed in the cylinder test was significantly increased at the 12-wk time point in unilaterally L1 Lamp2a-shRNA-rAAV-injected rats, while a similar trend occurred in L2 shRNA-rAAV-injected rats, indicating forelimb use asymmetry (*, p < 0.05; n = 7 animals/group, one-way ANOVA).
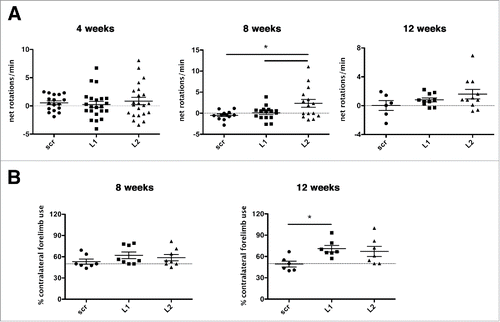
Figure 9. Deterioration of the dopaminergic system evoked by CMA impairment produces abnormal motor behavioral phenotypes. (A) LAMP2A downregulation with L2-shRNA resulted in increased net d-amphetamine-induced ipsilateral rotations at 8-wk post-injection, with a similar trend at 12 wk, indicating a unilateral motor impairment (*, p < 0.05; n = 22 animals/group for 4 wk, n = 15 animals/group for 8 wk, n = 11 animals/group for 12 wk, one-way ANOVA). (B) Contralateral forelimb use as assessed in the cylinder test was significantly increased at the 12-wk time point in unilaterally L1 Lamp2a-shRNA-rAAV-injected rats, while a similar trend occurred in L2 shRNA-rAAV-injected rats, indicating forelimb use asymmetry (*, p < 0.05; n = 7 animals/group, one-way ANOVA).
Supplemental material

KAUP_A_1214777_Supplementary_material.zip

Download Zip (9.3 MB)

Reprints and Corporate Permissions

Please note: Selecting permissions does not provide access to the full text of the article, please see our help page How do I view content?

To request a reprint or corporate permissions for this article, please click on the relevant link below:

Academic Permissions

Please note: Selecting permissions does not provide access to the full text of the article, please see our help page How do I view content?

Obtain permissions instantly via Rightslink by clicking on the button below:

If you are unable to obtain permissions via Rightslink, please complete and submit this Permissions form. For more information, please visit our Permissions help page.