Figures & data
Figure 1. HBx downregulates the expression of TNFRSF10B in HBV-infected cells. (A) TNFRSF10B expression levels in HepG-X and HepG-M cells were analyzed by semi-quantitative RT-PCR and immunoblot assay. (B) TNFRSF10B expression at the indicated time points after transfection with the control or HBx plasmid in HepG2 cells was analyzed by immunoblot assay. A representative immunoblot and quantification of the TNFRSF10B signal are shown. (C) TNFRSF10B expression levels in L02-X and L02-M cells were analyzed by semi-quantitative RT-PCR and immunoblot assay. (D) TNFRSF10B expression at the indicated time points after transfection of L02 cells with the control or HBx plasmid was analyzed by immunoblot assay. Quantification of the TNFRSF10B signal is shown. (E) Expression levels of TNFRSF10B in HepG2 and HepG2.2.15 cells were analyzed by semi-quantitative RT-PCR and immunoblot assay. (F) TNFRSF10B expression at the indicated time points after transfection in HepG2 cells with the control or HBV1.2mer plasmid was analyzed by immunoblot assay. A representative immunoblot and quantification of the TNFRSF10B signal are shown. (G) Representative immunocytochemical images of TNFRSF10B expression in HepG2 cells transiently transfected with the HBx plasmid. Cells transfected with the HBx-Flag or pcDNA3.1 vector were stained with anti-Flag (red) and anti-TNFRSF10B (green) antibodies. Among the HBx-positive cells, the percentage of cells showing reduced TNFRSF10B expression compared to control cells is indicated. (H) TNFRSF10B expression levels on the surface of HBx-expressing cells, HepG2.2.15 cells, and the corresponding control cells were analyzed by flow cytometry. Relative TNFRSF10B expression on the cell surface was calculated as the percentage of mean fluorescence intensity (MFI) as described in the Materials and Methods. All data are mean ± SD of 3 independent experiments. P-values were obtained by Student t test (*P < 0.05).
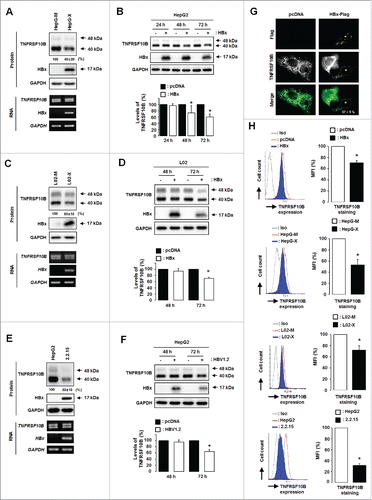
Figure 2. HBx promotes TNFRSF10B degradation through a lysosomal pathway. (A, B) Expression levels of TNFRSF10B upon treatment with MG132 (MG) or chloroquine (CQ) for 5 h were analyzed by immunoblot assay in HepG2 and HepG2.2.15 cells, and in HepG-M and HepG-X cells, respectively. (C, D) Expression levels of TNFRSF10B upon treatment with ALLN or carfilzomib (CZB) for 5 h were analyzed by immunoblot assay in HepG2 and HepG2.2.15 cells, and in HepG-M and HepG-X cells, respectively. (E) Expression levels of TNFRSF10B upon treatment with CQ for 5 h were analyzed by immunoblot assay in L02-M and L02-X cells. Con, control. Representative immunoblots and quantification of the TNFRSF10B signal are shown. Data are mean ± SD of 3 independent experiments. P-values were obtained by ANOVA (*P < 0.05).
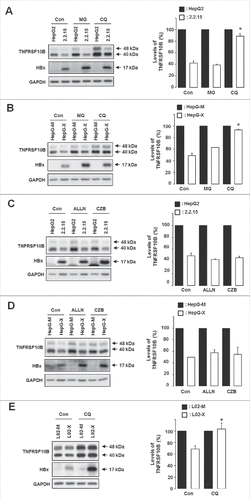
Figure 3. HBx promotes complete autophagy. Representative immunofluorescence images of autophagic cells (left) and their quantification (right). (A) HepG2 cells were cotransfected with the indicated plasmids and the tfLC3B plasmid. Cells with both red and green fluorescent LC3B dots (autophagosomes) and those with only red fluorescent LC3B dots (autolysosomes) were quantified as described in Materials and Methods. (B, C) HepG-X (B) or HepG2.2.15 (C) cells were transfected with the tfLC3B plasmid, and the formation of autophagosomes and autolysosomes was compared in these and the corresponding control cells as in (A). (D, E) Endogenous levels of LC3B and SQSTM1 in HepG2 (D) and L02 (E) cells were analyzed by immunoblot assay at the indicated time points after transfection with the HBx plasmid or HBV1.2mer. (F) Endogenous levels of LC3B and SQSTM1 in HepG-X, L02-X, and HepG2.2.15 cells were compared with those in the corresponding control cells. All data are mean ± SD of 3 independent experiments. P-values were obtained by Student t test (*P < 0.05).
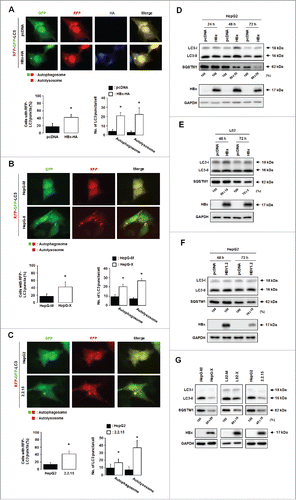
Figure 4. HBx-induced autophagy is responsible for TNFRSF10B degradation and downregulation of its cell surface expression. TNFRSF10B expression levels in HepG-X (A) and HepG2.2.15 (B) cells were analyzed after treatment with bafilomycin A1 (BAF) for the indicated times. The level of TNFRSF10B in control cells at each time point was set to 100%. (C) TNFRSF10B expression levels in HepG2 cells transfected with the HBx plasmid, and in HepG-X and HepG2.2.15 cells were analyzed after LC3B knockdown by siRNA. (D, E) HepG-X cells were transfected with the tfLC3B plasmid and treated with DMSO or 3-MA for 16 h (D), or cultured in normal or starvation (Earle's balanced salt solution, EBSS) medium for 16 h (E). Representative immunofluorescence images of autophagy detected by the presence of RFP-LC3B dots. N indicates the nucleus. Under the same conditions, the expression levels of TNFRSF10B and SQSTM1 were analyzed by immunoblotting. (F) Expression levels of TNFRSF10B on the surface of HepG-X and HepG2.2.15 cells were analyzed by flow cytometry after LC3B knockdown by siRNA or after 3-MA treatment. The relative expression of TNFRSF10B on the cell surface was calculated as the percentage of mean fluorescence intensity (MFI) as described in the Materials and Methods. Data are mean ± SD of 3 independent experiments. P-values were obtained by Student t test (*P < 0.05).
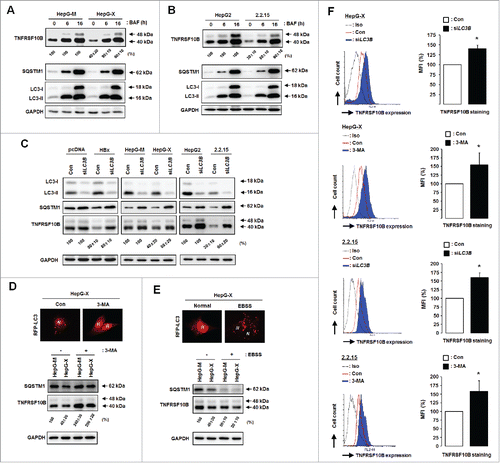
Figure 5. HBx facilitates the recruitment of TNFRSF10B to the autophagy machinery through ternary complex formation between HBx, TNFRSF10B, and LC3B. (A) Analysis of the interactions among LC3B, TNFRSF10B, and HBx in HBx-expressing cells by immunoprecipitation. At 48 h after transfection with the HBx-HA construct, cell lysates were immunoprecipitated with anti-LC3B antibody and proteins were detected by immunoblot assay. (B, C) Immunoprecipitation with anti-TNFRSF10B and anti-HA antibodies. (D) Analysis of the interaction between HBx and TNFRSF10B in LC3B knockdown cells by immunoprecipitation with anti-HA antibody. (E–G) Analysis of the interactions among LC3B, TNFRSF10B, and HBx in vitro by using a GST affinity isolation assay. GST or GST-HBx immobilized on glutathione resin was incubated with L02 cell lysates (E), purified recombinant TNFRSF10B (F), or purified recombinant LC3B (G). An aliquot of each incubation mixture was analyzed by immunoblotting to examine the input levels of each protein. Another aliquot was used for affinity isolation experiments and the bound proteins were detected by immunoblot assay. (H) Analysis of a direct interaction between LC3B and TNFRSF10B in vitro. Recombinant GST or GST-LC3B immobilized on glutathione resin was incubated with purified recombinant TNFRSF10B, and the affinity isolation assay was performed as above. (I) Proposed mechanism of HBx-mediated TNFRSF10B recruitment to the autophagy machinery. HBx activates autophagy and promotes TNFRSF10B recruitment to the autophagy machinery via interaction with LC3B, leading to TNFRSF10B degradation. This effect is blocked by LC3B knockdown, resulting in TNFRSF10B transport to the cell surface.
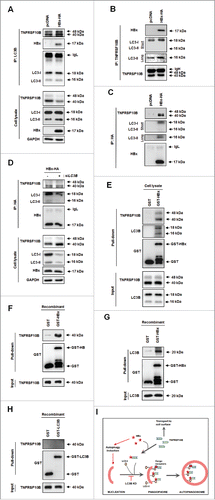
Figure 6. Expression level of TNFRSF10B is inversely related to autophagy activity in liver tissues of CHB patients. (A) Representative immunohistochemical images of TNFRSF10B expression in tissues of normal subjects and CHB patients (upper part) and relative levels of the TNFRSF10B protein (lower part). Paraffin-embedded sections of liver tissue arrays (healthy controls, n = 32; CHB patients, n = 32) were stained with anti-TNFRSF10B antibody. The expression levels of TNFRSF10B are shown as the inverted median pixel value (IMPV) as described in Fig. S1. (B) Representative immunohistochemical images of BECN1 staining (upper part) and analysis of BECN1 positivity (lower part) in CHB liver tissues. Paraffin-embedded sections of the same tissue arrays as in (A) were stained with anti-BECN1 antibody. BECN1 positivity was analyzed as described in the Materials and Methods. (C) Inverse relationship between BECN1 positivity and TNFRSF10B expression levels in clinical liver tissues. TNFRSF10B expression levels in BECN1-positive (n = 19) or -negative (n = 45) tissues were analyzed as described in the Materials and Methods. Representative immunohistochemical images (left) and relative TNFRSF10B expression (right) are shown. Data were obtained from 3 independent experiments and the P-values were obtained by Student t test.
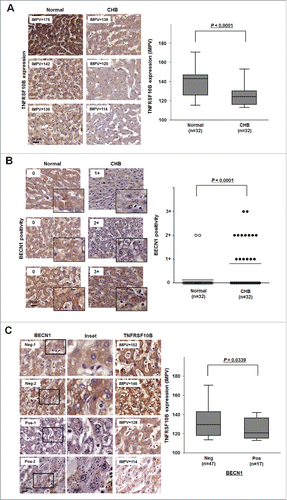
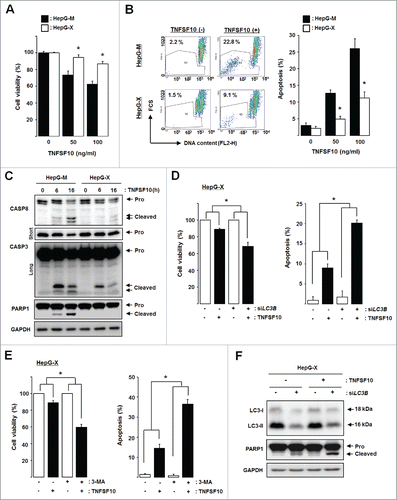
Figure 7. HBx-induced autophagy plays a cytoprotective role against TNFSF10-mediated cell death. (A) Cell viability and (B) apoptosis in cells stably expressing HBx. Cells were treated with TNFSF10 for 16 h, and MTT assay or flow cytometry analysis was performed as described in the Materials and Methods. (C) CASP activation in HepG-X cells. Cells were treated with TNFSF10 (100 ng/ml) for the indicated times, and immunoblot assay was performed. Pro, procaspase. For CASP3, short and long exposures are shown to visualize the procaspase and cleaved (active) forms, respectively. (D, E) Cell viability (left) and apoptosis (right) after LC3B knockdown by siRNA (D) or 3-MA treatment (E). (F) Caspase activity in HepG-X cells upon LC3B knockdown. All data are mean ± SD of 3 independent experiments. P-values were obtained by ANOVA (*P < 0.05).