Figures & data
Figure 1. MIR7–3HG (MIR-7) targets AMBRA1. (A) Schematics representing sequences of AMBRA1 MRE (top sequence) or its artificially mutated form (bottom sequence) cloned within the 3′-UTR of the reporter Renilla luciferase in the vector psiCHECK-2. Mutations are marked in lower case letters. MIR7–3HG seed sequence is in bold. (B) Normalized luciferase activity in lysates from HEK293 cells, co-transfected with the wild-type or mutant AMBRA1 luciferase constructs and negative control (Empty Vector) or MIR7–3HG plasmids (indicated as MIR7; mean ± SD of 3 independent experiments, *p < 0.05.) N.S., not significant. (C) Western blot analysis of cytoplasmic AMBRA1 levels 24 h after transfection with MIR7–3HG-encoding plasmids (indicated as MIR7) or negative control (Empty Vector). ACTB was used as an endogenous control. One representative western blot of 3 independent experiments is shown. The right panel shows ImageJ densitometry analysis of 3 independent experiments (mean ± SD of independent experiments,**p < 0.01). (D) AMBRA1 mRNA expression was analyzed by quantitative RT-qPCR 24 h after transfection with MIR7–3HG-encoding plasmids (indicated as MIR7) or negative control (Empty Vector). Relative quantification was measured by means of the comparative cycle threshold (ΔΔCt) method (mean ± SD of 3 independent experiments, *p < 0.05).
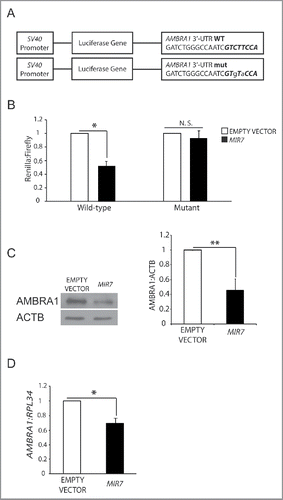
Figure 2. MIR7–3HG (MIR7) overexpression downregulates basal autophagy. (A) Analysis of cytoplasmic LC3-I and LC3-II levels, by using anti-LC3A/B antibody, on extracts from cells untreated or treated with chloroquine (CHQ; 20 μM, 30 min). All samples were analyzed 24 h after transfection with MIR7–3HG-encoding plasmids (indicated as MIR7) or negative control (Empty Vector). ACTB was used as a loading control. One representative western blot of 3 independent experiments is shown. The right graphs show the quantification of autophagy flux as the ratio between LC3-II in chloroquine-treated and LC3-II in untreated cells, the rate of LC3-I in LC3-II conversion and the quantification of LC3-II in the untreated samples. ImageJ densitometry analysis of 3 independent experiments (mean ± SD of independent experiments, *p < 0.05, ***p < 0.001). (B) MIR7–3HG blocked LC3 dot accumulation in samples treated with chloroquine. Cells were transfected with MIR7–3HG (indicated as MIR7) or Empty Vector and untreated (upper panels) or treated with chloroquine (20 μM, 30 min, lower panels). Scale bar: 5 μm. GFP fluorescence is shown in the red channel. The right graph shows the quantification of LC3 dots per transfected cell as the ratio between chloroquine-treated and -untreated cells (mean ± SD of 3 independent experiments, *p < 0.05). Statistical analysis was performed using the Student t test. (C) Overexpression of MIR7–3HG downregulates starvation-induced autophagy. Starvation-induced and autophagy related LC3-I to LC3-II conversion, by using anti-LC3A/B antibody, after MIR7–3HG overexpression (indicated as MIR7) is shown by immunoblots of control or MIR7–3HG-transfected cells that were nonstarved (STV-) or starved for 2 h (STV+). ACTB was used as loading control. The right graph shows ImageJ densitometry analysis of 3 independent experiments (mean ± SD of independent experiments, *p < 0.05, **p < 0.01). (D) Analysis of LC3 dot formation in HeLa cells, transfected with MIR7–3HG (indicated as MIR7) or empty vector. Autophagy was assessed under starvation conditions (2 h, lower panels). Scale bar: 5 μm. GFP fluorescence is shown in the red channel. The right graph shows the quantification of LC3 dots per transfected cell as the ratio between starved and nonstarved cells (mean ± SD of 3 independent experiments, **p < 0.01). Statistical analysis was performed using the Student t test. (E) Analysis of the starvation-induced and autophagy-related SQSTM1 degradation in MIR7–3HG transfected HeLa cells (indicated as MIR7). The right graph shows ImageJ densitometry analysis of 3 independent experiments (mean ± SD of independent experiments, ***p < 0.001, **p < 0.01).
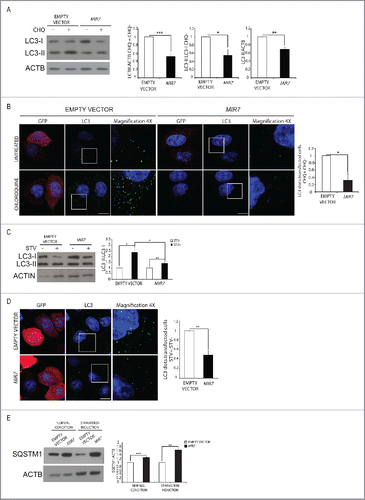
Figure 3. Overexpression of MIR7–3HG-insensible AMBRA1 rescues the autophagy phenotype. (A) Scheme representing sequences of AMBRA1 mRNA with wild-type 3′-UTR (top sequence) or its artificially mutated form in the MIR7–3HG responsive element (bottom sequence). Mutations are marked in lower case letters. MIR7–3HG seed sequence is in bold. (B) Western blot analysis of AMBRA1 wild-type or mutated 24 h after cotransfection with MIR7–3HG-encoding plasmids (indicated as MIR7) or negative control (Empty Vector). Different bands are detected upon AMBRA1 overexpression, with the band indicated by the arrow corresponding to the expected size-range for full-length AMBRA1. The other bands, with lower molecular weights, correspond to AMBRA1 full-length cleavage products.Citation28 ACTB was used as endogenous control. One representative western blot of 3 independent experiments is shown. The right panel shows ImageJ densitometry analysis of the band of 3 independent experiments (mean ± SD of independent experiments,**p <0.01). (C) Analysis of autophagy flux following overexpression of AMBRA1 wild type or mutated, 24 h after cotransfection with MIR7–3HG-encoding plasmids (indicated as MIR7) or negative control (Empty Vector). Western blot analysis of LC3-II and SQSTM1 accumulation, using LC3B and SQSTM1 antibody, in extracts from cells untreated or treated with chloroquine (CHQ; 20 μM, 30 min). ACTB was used as loading control. One representative western blot of 3 independent experiments is shown. The right graphs show the quantification of autophagy flux measures as the ratio between LC3-II and SQSTM1 in chloroquine-treated and untreated cells (upper graphs), the rate of LC3-I to LC3-II conversion and the quantification of LC3-II (lower graphs) in the untreated samples. The data show ImageJ densitometry analysis of 3 independent experiment (mean ± SD of independent experiments, *p < 0.05,**p < 0.01, ***p < 0.001).
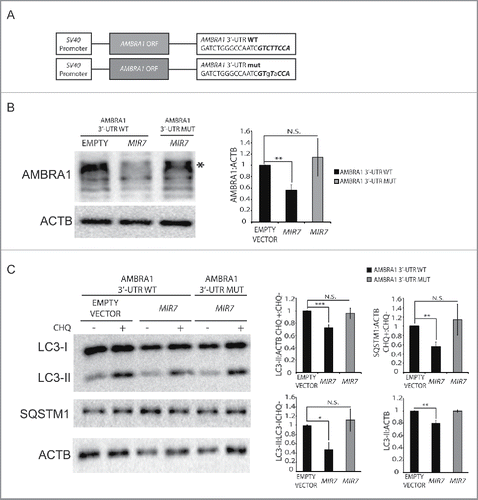
Figure 4. Inhibition of endogenous MIR7–3HG (MIR7) leads to AMBRA1 upregulation and increased autophagy. (A) Western blot analysis in the A549 cell line of cytoplasmic AMBRA1 and SQSTM1 levels, 72 h after transfection with siMIR7 (siRNA anti-MIR7–3HG) or negative control (Ctrl siRNA, control siRNA). ACTB was used as an endogenous control. One representative western blot of 3 independent experiments is shown. The right panels show ImageJ densitometry analysis of 3 independent experiments (mean ± SD of independent experiments, **p < 0.01). (B) AMBRA1 mRNA expression was analyzed by quantitative RT-PCR, 72 h after overexpression of siMIR7–3HG (indicated as siMIR7). Relative quantification was measured by means of the comparative cycle threshold (ΔΔCt) method (mean ± SD of 3 independent experiments, *p < 0.05). (C) Analysis of cytoplasmic LC3-I and LC3-II levels, by using anti-LC3A/B antibody, on extracts from cells untreated or treated with chloroquine (20 μM, 30 min). All samples were analyzed 72 h after transfection with siMIR7 (siRNA anti-MIR7–3HG) or negative control (Ctrl siRNA, control siRNA). ACTB was used as a loading control. One representative western blot of 3 independent experiments is shown. The right graphs show the quantification of autophagy flux as the ratio between LC3-II in chloroquine-treated and untreated cells, the rate of LC3-I to LC3-II conversion and the quantification of LC3-II in the untreated samples. ImageJ densitometry analysis of 3 independent experiments (mean ± SD of independent experiments, *p < 0.05).
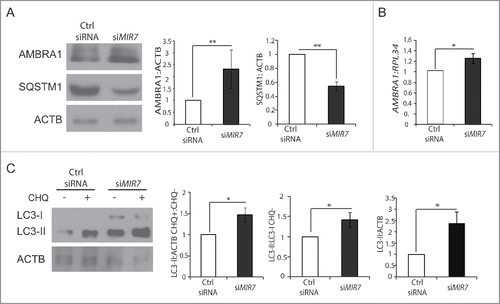
Figure 5. Inhibition of endogenous MIR7–3HG (MIR7) leads to an increase of MYC dephosphorylation and to a decrease in cell proliferation. (A) Western blot analysis of AMBRA1, p-MYC (S62) and MYC levels, 72 h after A549 cells transfection with siMIR7 (siRNA anti-MIR7–3HG) or negative siRNA control (Ctrl siRNA, control siRNA). ACTB was used as a loading control. One representative western blot of 3 independent experiments is shown. The right graph shows the ratio between p-MYC (S62) and MYC proteins (ImageJ densitometry analysis of 3 independent experiments [mean ± SD of independent experiments, ***p < 0.001]). (B) Cells transfected with siMIR7–3HG or negative siRNA control (Ctrl siRNA, control siRNA) were treated with 50 μg ml−1 cycloheximide (CHX) and collected at the indicated time points. Protein extracts of cells were analyzed by western blot, using antibodies against MYC. ACTB was used as a loading control. The right panel shows ImageJ densitometry analysis of the band of 3 independent experiments (mean ± SD of independent experiments,**p < 0.01, *p < 0.05). (C) Western blot analysis in the A549 cell line of cytoplasmic p-MYC (S62) 72 h after transfection with a plasmid encoding AMBRA1WT, AMBRA1PXP or with GLB1/ß-galactosidase, as a negative control. The right graph shows the relative quantification of endogenous MIR7–3HG in A549 cells after transfection. The level of endogenous MIR7–3HG was analyzed by quantitative RT-PCR. Relative quantification was measured using the comparative cycle threshold (ΔΔCt) method (mean ± SD of 3 independent experiments, *p < 0.05).
![Figure 5. Inhibition of endogenous MIR7–3HG (MIR7) leads to an increase of MYC dephosphorylation and to a decrease in cell proliferation. (A) Western blot analysis of AMBRA1, p-MYC (S62) and MYC levels, 72 h after A549 cells transfection with siMIR7 (siRNA anti-MIR7–3HG) or negative siRNA control (Ctrl siRNA, control siRNA). ACTB was used as a loading control. One representative western blot of 3 independent experiments is shown. The right graph shows the ratio between p-MYC (S62) and MYC proteins (ImageJ densitometry analysis of 3 independent experiments [mean ± SD of independent experiments, ***p < 0.001]). (B) Cells transfected with siMIR7–3HG or negative siRNA control (Ctrl siRNA, control siRNA) were treated with 50 μg ml−1 cycloheximide (CHX) and collected at the indicated time points. Protein extracts of cells were analyzed by western blot, using antibodies against MYC. ACTB was used as a loading control. The right panel shows ImageJ densitometry analysis of the band of 3 independent experiments (mean ± SD of independent experiments,**p < 0.01, *p < 0.05). (C) Western blot analysis in the A549 cell line of cytoplasmic p-MYC (S62) 72 h after transfection with a plasmid encoding AMBRA1WT, AMBRA1PXP or with GLB1/ß-galactosidase, as a negative control. The right graph shows the relative quantification of endogenous MIR7–3HG in A549 cells after transfection. The level of endogenous MIR7–3HG was analyzed by quantitative RT-PCR. Relative quantification was measured using the comparative cycle threshold (ΔΔCt) method (mean ± SD of 3 independent experiments, *p < 0.05).](/cms/asset/7245afd0-93da-4403-9386-f0e3502a47ce/kaup_a_1269989_f0005_b.gif)
Figure 6. MIR7–3HG (MIR7) affects proliferation in an AMBRA1-dependent manner. (A) The graph shows the MIR7–3HG overexpression effect on cell proliferation in HeLa cells. (B) The left graph shows the siMIR7–3HG effect on cell proliferation in A549 cells. In (A) and (B) the proliferation rate was measured by the AlamarBlue® Cell Viability assay. All samples were analyzed 48 h after transfection with siMIR7–3HG or the negative control siRCtrl (mean ± SD of independent experiments, *p < 0,05; ***p < 0.001). (C) Inverse correlation between MIR7–3HG levels and AMBRA1 expression in lung cancer. Expression levels of AMBRA1 (left graphs) and MIR7–3HG (right graphs) in LUAD (upper graphs) and LUSC (lower graphs) datasets from TCGA comparing normal (NT) to tumor primary (TP) samples. Center lines in the boxplot show the medians; box limits indicate the 25th and 75th percentiles as determined by R software; whiskers extend 1.5 times the interquartile range from the 25th and 75th percentiles, outliers are represented by dots.
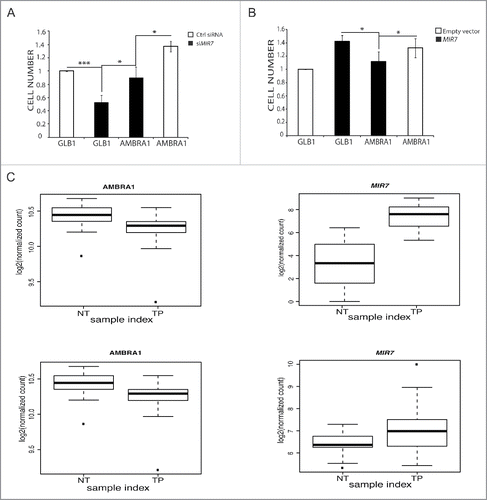
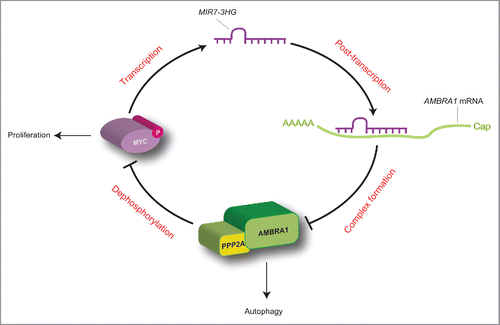
Figure 7. Proposed working model for the MYC-MIR7–3HG-AMBRA1 axis. In this regulatory loop, MIR7–3HG downregulates AMBRA1 expression, and promotes its own transcription mediated by MYC. This model favors cell proliferation to the detriment of autophagy (for details see the text).
