2,525
Views
42
CrossRef citations to date
0
Altmetric
Basic Research Paper

MIR506 induces autophagy-related cell death in pancreatic cancer cells by targeting the STAT3 pathway

, , , , , , , , & show all
Pages 703-714 | Received 31 May 2016, Accepted 30 Dec 2016, Published online: 09 Mar 2017

Figures & data

Figure 1. MIR506 downregulation correlates with disease progression in human PDAC. (A) Comparison of MIR506 expression in 92 matched pairs of PDAC tissues and corresponding nontumor tissues via qRT-PCR. RNU6 was used as an internal control. (B) Comparison of MIR506 expression in stage T1-T2 and stage T3-T4 PDAC tissues. (C) Comparison of MIR506 expression in stage I-II and stage III-IV PDAC tissues. *P < 0.05; **P < 0.01. (D) Kaplan-Meier curves compared the overall survival rates of PDAC patients whose tumor expressed a low or high level of MIR506. The median value was used as the cut-off point for definition of low and high MIR506 expression groups.
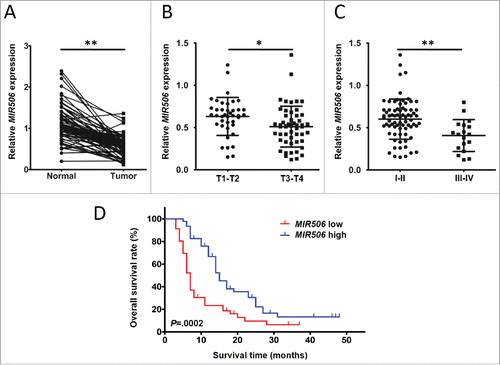
Figure 1. MIR506 downregulation correlates with disease progression in human PDAC. (A) Comparison of MIR506 expression in 92 matched pairs of PDAC tissues and corresponding nontumor tissues via qRT-PCR. RNU6 was used as an internal control. (B) Comparison of MIR506 expression in stage T1-T2 and stage T3-T4 PDAC tissues. (C) Comparison of MIR506 expression in stage I-II and stage III-IV PDAC tissues. *P < 0.05; **P < 0.01. (D) Kaplan-Meier curves compared the overall survival rates of PDAC patients whose tumor expressed a low or high level of MIR506. The median value was used as the cut-off point for definition of low and high MIR506 expression groups.

Figure 2. MIR506 induces cell death in human PDAC cells. (A) MDA-PATC53, MDA-PATC124, and MDA-PATC148 cells were transfected with MIRctrl or MIR506 for 5 d. Cell viability was measured by the MTT assay every day. (B) After transfection with MIRctrl or MIR506, cells were trypsinized and collected in PBS, and cell death was quantified by trypan blue exclusion assay every day. Data represent mean ± SD of at least of 3 independent experiments. **P < 0.01.
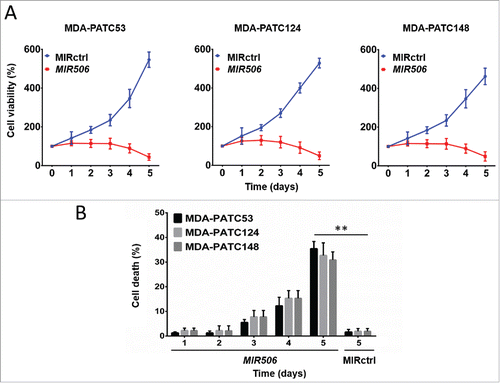
Figure 2. MIR506 induces cell death in human PDAC cells. (A) MDA-PATC53, MDA-PATC124, and MDA-PATC148 cells were transfected with MIRctrl or MIR506 for 5 d. Cell viability was measured by the MTT assay every day. (B) After transfection with MIRctrl or MIR506, cells were trypsinized and collected in PBS, and cell death was quantified by trypan blue exclusion assay every day. Data represent mean ± SD of at least of 3 independent experiments. **P < 0.01.

Figure 3. Cell death caused by MIR506 is dependent on autophagy. (A) MDA-PATC53 cells were transfected with MIRctrl or MIR506 or pretreated with apoptosis-inducer 5-FU in the absence (DMSO) or presence of the selective apoptosis inhibitor z-VAD-FMK (z-VAD; 20 mM) for 96 h; (B) MDA-PATC53 cells were transfected with MIRctrl or MIR506 or pretreated with the necrosis promoter t-BHP in the absence (DMSO) or presence of necrosis inhibitor IM-54 (10 mM) for 96 h; (C) MDA-PATC53 cells were pretreated with the autophagy inhibitor 3-MA (5 mM) or CQ (50 μM) or transfected with shRNAs to knock down ATG5 or ATG7 first, and then transfected with MIRctrl or MIR506 for 96 h. Cells were trypsinized and analyzed by flow cytometry after being stained with FITC-labeled ANXA5-PI. (D-F) After pretreatment as described in (A-C), cell death was also quantified by trypan blue exclusion assay. (G) MDA-PATC53 cells were transfected with MIRctrl or MIR506 or pretreated with 5-FU in the absence (DMSO) or presence of z-VAD-FMK (20 mM) for 96 h. Cells were labeled with Apo-BrdU and analyzed by flow cytometry. (H) After pretreatment as described in (G), whole-cell extracts of MDA-PATC53 cells were subjected to immunoblotting with anti-CASP3 and -CASP9 antibodies. (I) MDA-PATC53 cells were pretreated with or without the LMP inducer LLOMe (2 mM) or transfected with MIRctrl or MIR506 for 96 h. Cells were fixed for immunofluorescent staining with anti-LGALS1 or -LGALS3 antibody and visualized with a fluorescence microscope. Data represent mean ± SD of at least of 3 independent experiments. NS, not significant; *P < 0.05. Scale bar: 10 μm.
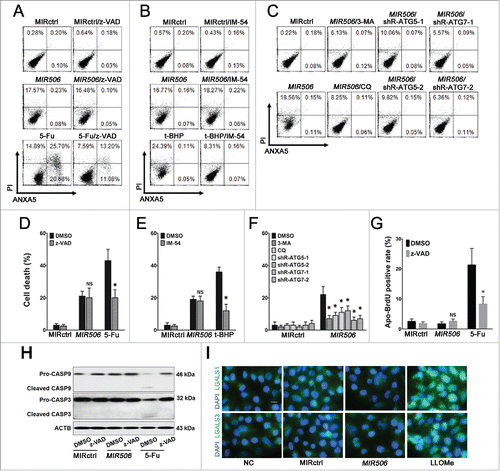
Figure 3. Cell death caused by MIR506 is dependent on autophagy. (A) MDA-PATC53 cells were transfected with MIRctrl or MIR506 or pretreated with apoptosis-inducer 5-FU in the absence (DMSO) or presence of the selective apoptosis inhibitor z-VAD-FMK (z-VAD; 20 mM) for 96 h; (B) MDA-PATC53 cells were transfected with MIRctrl or MIR506 or pretreated with the necrosis promoter t-BHP in the absence (DMSO) or presence of necrosis inhibitor IM-54 (10 mM) for 96 h; (C) MDA-PATC53 cells were pretreated with the autophagy inhibitor 3-MA (5 mM) or CQ (50 μM) or transfected with shRNAs to knock down ATG5 or ATG7 first, and then transfected with MIRctrl or MIR506 for 96 h. Cells were trypsinized and analyzed by flow cytometry after being stained with FITC-labeled ANXA5-PI. (D-F) After pretreatment as described in (A-C), cell death was also quantified by trypan blue exclusion assay. (G) MDA-PATC53 cells were transfected with MIRctrl or MIR506 or pretreated with 5-FU in the absence (DMSO) or presence of z-VAD-FMK (20 mM) for 96 h. Cells were labeled with Apo-BrdU and analyzed by flow cytometry. (H) After pretreatment as described in (G), whole-cell extracts of MDA-PATC53 cells were subjected to immunoblotting with anti-CASP3 and -CASP9 antibodies. (I) MDA-PATC53 cells were pretreated with or without the LMP inducer LLOMe (2 mM) or transfected with MIRctrl or MIR506 for 96 h. Cells were fixed for immunofluorescent staining with anti-LGALS1 or -LGALS3 antibody and visualized with a fluorescence microscope. Data represent mean ± SD of at least of 3 independent experiments. NS, not significant; *P < 0.05. Scale bar: 10 μm.

Figure 4. MIR506 induces autophagic flux in PDAC cells. (A) MDA-PATC53 cells were transfected with MIRctrl or MIR506 in the absence or presence of the autophagy inhibitor 3-MA (5 mM) for 72 h. Cells were fixed for immunofluorescent staining with anti-LC3 antibody and visualized with a fluorescence microscope. (B) The LC3 puncta in each cell were counted. n = 100 cells/sample, **P<0.01. (C) MDA-PATC53 cells were transfected with MIRctrl or MIR506 for 48 h and infected with Autophagy Tandem Sensor RFP-GFP-LC3 in the absence or presence of 3-MA (5 mM) for 24 h. Then, cells were visualized with a fluorescence microscope. (D) The autophagosomes (yellow dots) and autolysosomes (red-only dots) in each cell were counted. n = 100 cells/sample. (E) MDA-PATC53 cells were transfected with MIRctrl or MIR506 in the absence or presence of the vacuolar-type H+-ATPase inhibitor Baf-A (10 nM). Whole-cell extracts were subjected to immunoblotting with anti-LC3 and -SQSTM1 antibodies. Scale bar: 10 μm.
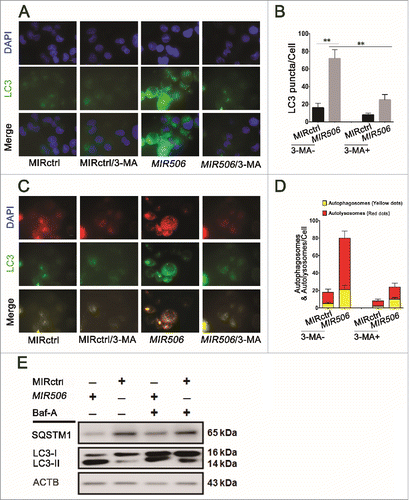
Figure 4. MIR506 induces autophagic flux in PDAC cells. (A) MDA-PATC53 cells were transfected with MIRctrl or MIR506 in the absence or presence of the autophagy inhibitor 3-MA (5 mM) for 72 h. Cells were fixed for immunofluorescent staining with anti-LC3 antibody and visualized with a fluorescence microscope. (B) The LC3 puncta in each cell were counted. n = 100 cells/sample, **P<0.01. (C) MDA-PATC53 cells were transfected with MIRctrl or MIR506 for 48 h and infected with Autophagy Tandem Sensor RFP-GFP-LC3 in the absence or presence of 3-MA (5 mM) for 24 h. Then, cells were visualized with a fluorescence microscope. (D) The autophagosomes (yellow dots) and autolysosomes (red-only dots) in each cell were counted. n = 100 cells/sample. (E) MDA-PATC53 cells were transfected with MIRctrl or MIR506 in the absence or presence of the vacuolar-type H+-ATPase inhibitor Baf-A (10 nM). Whole-cell extracts were subjected to immunoblotting with anti-LC3 and -SQSTM1 antibodies. Scale bar: 10 μm.

Figure 5. MIR506 directly targets STAT3 and induces autophagy-related cell death in a STAT3-dependent manner. (A) A MIR506 binding site was predicted in the 3′-UTR of STAT3 by TargetScan. (B) A luciferase reporter assay showed that MIR506 directly targeted the STAT3 3′-UTR. MDA-PATC53 cells were cotransfected with wild-type or mutant STAT3 3′-UTR-luciferase reporter and MIRctrl or MIR506 mimic for 72 h before analysis. The firefly and renilla luciferase activities were measured using a Dual Luciferase Reporter Assay System. (C-D) MDA-PATC53, MDA-PATC124, MDA-PATC148, MDA-PATC50, and MDA-PATC69 cells were transfected with MIRctrl or MIR506. Whole-cell extracts were subjected to immunoblotting with anti-STAT3, anti-p-STAT3, and anti-LC3 antibodies. (E) The expression level of STAT3 was detected by qRT-PCR and normalized to the endogenous control GAPDH. (F) Cell death was quantified by trypan blue exclusion assay. Data represent the mean ± SD of at least 3 independent experiments. NS, not significant; **P < 0.01.
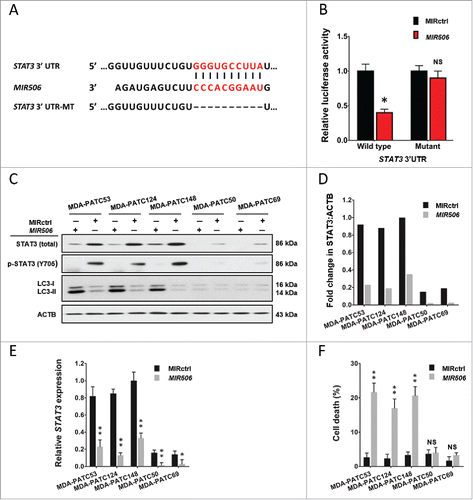
Figure 5. MIR506 directly targets STAT3 and induces autophagy-related cell death in a STAT3-dependent manner. (A) A MIR506 binding site was predicted in the 3′-UTR of STAT3 by TargetScan. (B) A luciferase reporter assay showed that MIR506 directly targeted the STAT3 3′-UTR. MDA-PATC53 cells were cotransfected with wild-type or mutant STAT3 3′-UTR-luciferase reporter and MIRctrl or MIR506 mimic for 72 h before analysis. The firefly and renilla luciferase activities were measured using a Dual Luciferase Reporter Assay System. (C-D) MDA-PATC53, MDA-PATC124, MDA-PATC148, MDA-PATC50, and MDA-PATC69 cells were transfected with MIRctrl or MIR506. Whole-cell extracts were subjected to immunoblotting with anti-STAT3, anti-p-STAT3, and anti-LC3 antibodies. (E) The expression level of STAT3 was detected by qRT-PCR and normalized to the endogenous control GAPDH. (F) Cell death was quantified by trypan blue exclusion assay. Data represent the mean ± SD of at least 3 independent experiments. NS, not significant; **P < 0.01.

Figure 6. MIR506 induces autophagy-related cell death through the STAT3 signaling pathway. (A) MDA-PATC53, MDA-PATC124, and MDA-PATC148 cells were transfected with MIRctrl or MIR506 for 72 h. Whole-cell extracts were subjected to immunoblotting with anti-STAT3, anti-p-STAT3, anti-BECN1, -BCL2, and -LC3 antibodies. (B-C) MDA-PATC53, MDA-PATC124, and MDA-PATC148 cells were treated with the indicated concentrations of the STAT3 inhibitor Stattic for the indicated times. (D-E) Cell death was quantified by trypan blue exclusion assay. (F) MDA-PATC53, MDA-PATC124, and MDA-PATC148 cells were transfected with control siRNA (siR-ctrl) or 1 of 2 siRNAs against STAT3 (siR-STAT3–1 or siR-STAT3–2). Whole-cell extracts were subjected to immunoblotting with anti-STAT3, anti-p-STAT3, anti-BECN1, -BCL2, and -LC3 antibodies. (G) Cell death was quantified by trypan blue exclusion assay. (H-I) MDA-PATC53 cells overexpressing wild-type or Y705-mutated STAT3 were transfected with MIRctrl or MIR506 and analyzed by immunoblotting and trypan blue exclusion assay as described above. (J-K) MDA-PATC53 cells were transfected with control shRNA (shR-ctrl) or 1 of 2 shRNAs against BECN1 (siR-BECN1–1 or siR-BECN1–2) and analyzed by immunoblotting and trypan blue exclusion assay as described above. (L-M) MDA-PATC53 cells overexpressing BCL2 were transfected with MIRctrl or MIR506 and analyzed by immunoblotting and trypan blue exclusion assay as described above. Data represent the mean ± SD of at least of 3 independent experiments. NS, not significant; *P < 0.05; **P < 0.01.
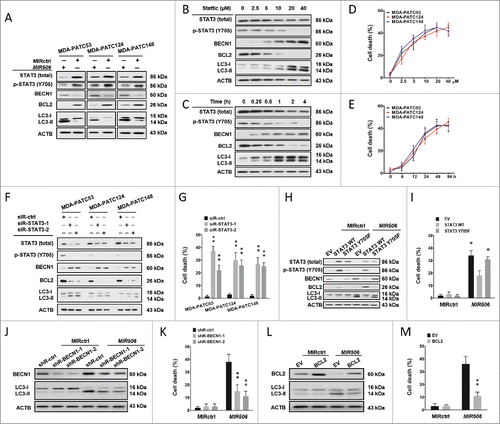
Figure 6. MIR506 induces autophagy-related cell death through the STAT3 signaling pathway. (A) MDA-PATC53, MDA-PATC124, and MDA-PATC148 cells were transfected with MIRctrl or MIR506 for 72 h. Whole-cell extracts were subjected to immunoblotting with anti-STAT3, anti-p-STAT3, anti-BECN1, -BCL2, and -LC3 antibodies. (B-C) MDA-PATC53, MDA-PATC124, and MDA-PATC148 cells were treated with the indicated concentrations of the STAT3 inhibitor Stattic for the indicated times. (D-E) Cell death was quantified by trypan blue exclusion assay. (F) MDA-PATC53, MDA-PATC124, and MDA-PATC148 cells were transfected with control siRNA (siR-ctrl) or 1 of 2 siRNAs against STAT3 (siR-STAT3–1 or siR-STAT3–2). Whole-cell extracts were subjected to immunoblotting with anti-STAT3, anti-p-STAT3, anti-BECN1, -BCL2, and -LC3 antibodies. (G) Cell death was quantified by trypan blue exclusion assay. (H-I) MDA-PATC53 cells overexpressing wild-type or Y705-mutated STAT3 were transfected with MIRctrl or MIR506 and analyzed by immunoblotting and trypan blue exclusion assay as described above. (J-K) MDA-PATC53 cells were transfected with control shRNA (shR-ctrl) or 1 of 2 shRNAs against BECN1 (siR-BECN1–1 or siR-BECN1–2) and analyzed by immunoblotting and trypan blue exclusion assay as described above. (L-M) MDA-PATC53 cells overexpressing BCL2 were transfected with MIRctrl or MIR506 and analyzed by immunoblotting and trypan blue exclusion assay as described above. Data represent the mean ± SD of at least of 3 independent experiments. NS, not significant; *P < 0.05; **P < 0.01.
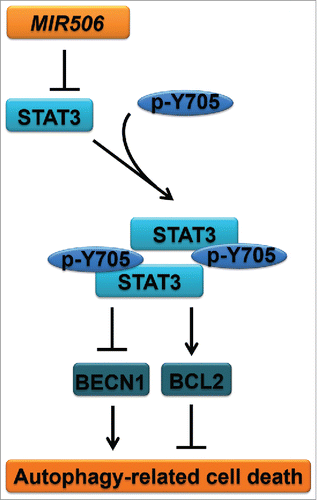
Figure 7. Schematic of the proposed mechanism of MIR506 induction of autophagy-related cell death in PDAC cells through the STAT3 signaling pathway.

Figure 7. Schematic of the proposed mechanism of MIR506 induction of autophagy-related cell death in PDAC cells through the STAT3 signaling pathway.
Supplemental material

Supplementary files

Download MS Word (4.7 MB)

Reprints and Corporate Permissions

Please note: Selecting permissions does not provide access to the full text of the article, please see our help page How do I view content?

To request a reprint or corporate permissions for this article, please click on the relevant link below:

Academic Permissions

Please note: Selecting permissions does not provide access to the full text of the article, please see our help page How do I view content?

Obtain permissions instantly via Rightslink by clicking on the button below:

If you are unable to obtain permissions via Rightslink, please complete and submit this Permissions form. For more information, please visit our Permissions help page.