Figures & data
Figure 1. MA9-induced leukemia cells exhibit a high autophagy flux. (A) MA9-transformed leukemia cells and empty vector-transduced normal low-density bone marrow cells were treated with chloroquine at the indicated dosages for 6 h followed by western blotting. LDBM, low-density bone marrow cells; CQ, chloroquine; MA9; MA9 retrovirally-transduced leukemia cells. Quantification is LC3-II:ACTB ratio (n = 4 mice). (B) Leukemia cells and LDBM cells described in (A) were treated with CQ for 6 h at 25 μM before immunostaining for LC3. Scale bar: 10 μm. Quantification is percentage of LC3 puncta positive cells. Cells with more than 1 punctum are considered positive for quantification. (n = 3 mice). (C) Leukemia cells and LDBM cells described in (A) were treated with bafilomycin A1 (BA) for 4 h at 20 nM followed by western blot analysis. Quantification is the LC3-II:ACTB ratio (n = 3 mice). Results are shown as mean ± SD, * P < 0.05, ** P < 0.01, *** P < 0.001.
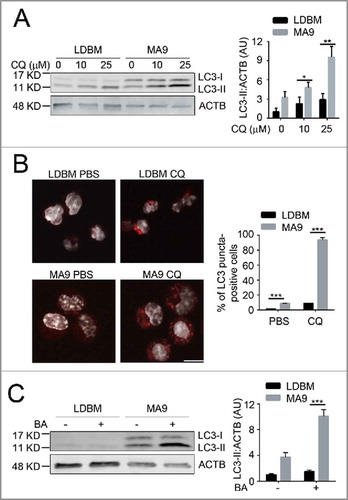
Figure 2. Atg5 is dispensable for MA9-AML cell growth and survival in vitro. (A) Clean Atg5-deleted MA9 cells were prepared through 4-OHT treatment and colony selection. MA9-Atg5+/+ and MA9-atg5−/− leukemia cells were treated with chloroquine at the indicated dosages for 6 h followed by western blot analysis. Numbers represent the densitometry quantification of protein levels normalized to ACTB (n = 4 repeats). MA9-Atg5+/+, Atg5 wild-type MA9 leukemia cells; MA9-atg5−/−, Atg5-deficient MA9 leukemia cells. (B) Basal cell growth rates of MA9-Atg5+/+ and MA9-atg5−/− cells were analyzed by MTS assay at the indicated time points. OD: 490 nM (n = 6 repeats). Results are mean ± SD, * P < 0.05. (C) Five hundred MA9-Atg5+/+ or MA9-atg5−/− leukemia cells were plated in M3434 medium for 5 d followed by colony counting (n = 3 repeats). Images show representative colonies. Images were taken by light microscopy (Olympus, CKX41) under the 10X objective. Scale bar: 100 μm.
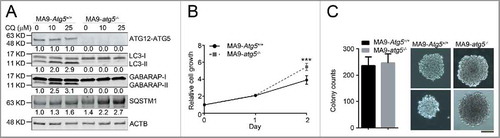
Figure 3. Atg5 disruption does not benefit MA9-AML mice survival. (A) Illustration of transplantation strategy: 1 million leukemia cells together with 0.25 million supporting cells were transplanted into BoyJ recipient mice after lethal irradiation. Intraperitoneal injection of polyI:C (plpC) was started 20 d post transplantation at the dosage of 100 μg/g, every other day for 4 injections. (B) Kaplan-Meier survival curve for the primary transplantation (n = 7 in Atg5f/f group, n = 8 in Atg5f/fMxCre group). (C) Kaplan-Meier survival curve for the secondary transplantation (n = 6 in Atg5f/f group, n = 5 in Atg5f/fMxCre group).
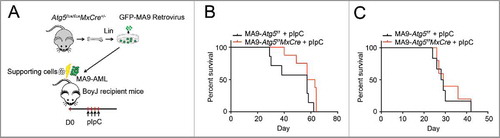
Figure 4. Rb1cc1 deficiency does not affect the maintenance of MA9-AML cells. (A) Clean Rb1cc1-deleted cells were prepared through 4-OHT treatment and colony selection. MA9-Rb1cc1+/+ and MA9-rb1cc1−/− leukemia cells were treated with chloroquine at the indicated dosages for 6 h before western blot analysis. Numbers represent the densitometry quantification of protein levels normalized to ACTB (n = 3 repeats). MA9-Rb1cc1+/+, Rb1cc1 wild-type MA9 leukemia cells; MA9-rb1cc1−/−, Rb1cc1-deficient MA9 leukemia cells. (B) Basal cell growth rates of MA9-Rb1cc1+/+ and MA9-rb1cc1−/− cells were analyzed by MTS assay at the indicated time points (n = 4 repeats). (C) MA9-Rb1cc1+/+ and MA9-rb1cc1−/− leukemia cells stained with CellROX Deep Red reagent or MitoTracker Red were analyzed by flow cytometry for ROS or mitochondria levels at basal state, respectively (n = 4 repeats). MFI, mean fluorescence intensity. (D) MA9-Rb1cc1+/+ and MA9-rb1cc1−/− cells under basal state were harvested and used for western blot analysis of the mitochondria protein COX4.
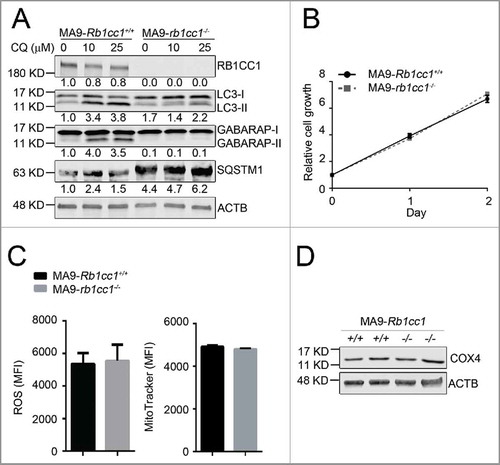
Figure 5. Atg5 or Rb1cc1 deficiency does not affect the lysosomal degradation pathway. (A) MA9 wild-type, MA9-atg5−/− and MA9-rb1cc1−/− leukemia cells were treated with chloroquine at 25 μM for 6 h followed by TEM imaging. Scale bar: 500 nm. (B) MA9 wild-type, MA9-atg5−/− and MA9-rb1cc1−/− leukemia cells cultured under basal condition were harvested and used for western blot analysis (n = 2 repeats).
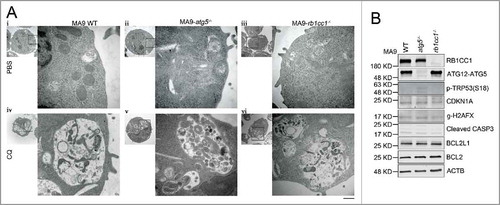
Figure 6. Loss of Atg5 or Rb1cc1 does not sensitize MA9-AML cells to chemotherapy. MA9-Atg5+/+ and MA9-atg5−/− , or MA9-Rb1cc1+/+ and MA9-rb1cc1−/− leukemia cells were treated with chemotherapy drugs or an ER stressor at the indicated dosages for 48 h followed by MTS assay. AraC, cytarabine; DA, doxorubicin; Tuni, tunicamycin. Results are mean ± SD, ** P < 0.01, *** P < 0.001 (n = 3 to 6 repeats).
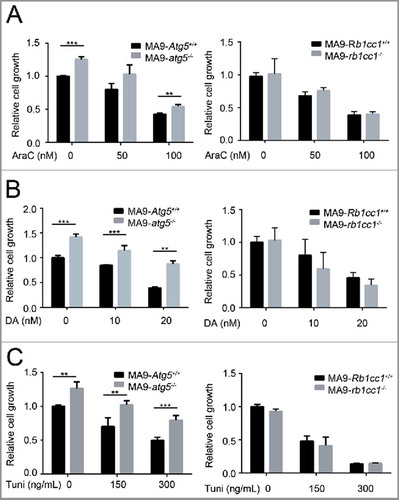
Figure 7. Chloroquine shows an autophagy-independent anti-leukemic effect in vitro, but is not potent in vivo. (A) MA9 knock-in leukemia cells (MA9-KI), MA9-Retro and wild-type Lin− bone marrow cells were treated with chloroquine at the indicated dosages for 48 h followed by MTS assay (n = 3 repeats). (B) MA9-Atg5+/+ and MA9-atg5−/− leukemia cells were treated with chloroquine at the indicated dosages for 48 h before MTS assay (n = 4 repeats). Results are mean ± SD, ** P < 0.01, *** P < 0.001. (C) Kaplan-Meier survival curve of chloroquine and AraC combinatory treatment in MA9-AML leukemia mice. AraC was injected intraperitoneally at 100 mg/kg once a day for 5 d. Chloroquine was injected at 50 mg/kg twice a day for 5 d (n = 6 in each group). The transplantation method is as described in . (D) For ex vivo assay, chloroquine was injected as described in (C). Bone marrow Lin− cells were harvested within 2 h after the last injection followed by western blot analysis. For in vitro assay, bone marrow Lin− cells were treated with chloroquine at 10 μΜ for 6 h followed by western blot analysis. Quantification is the LC3-II:ACTB ratio (n = 3 mice). Results are mean ± SD, * P < 0.05. AU, arbitrary units.
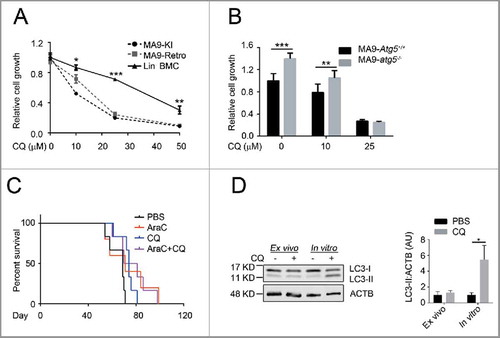
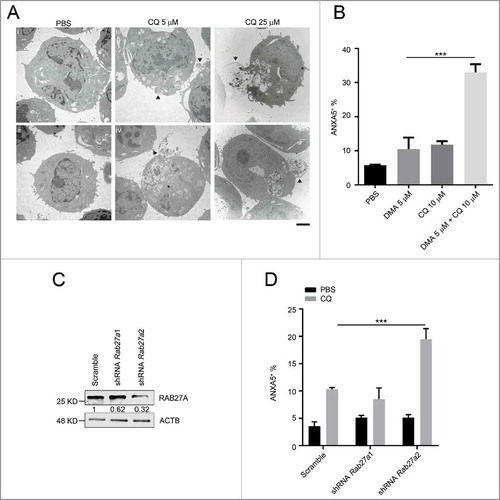
Figure 8. The anti-leukemic activity of chloroquine is enhanced by exocytosis inhibition. (A) MA9 leukemia cells were treated with chloroquine at 5 μM for 2 h or at 25 μM for 6 h followed by TEM analysis. Scale bar: 2 μm. (B) Chloroquine and DMA combinatory treatment at the indicated dosages for 24 h followed by ANXA5 and 7-AAD staining for apoptosis analysis by flow cytometry. Results are mean ± SD, *** P < 0.001 (n = 6 repeats). (C) MA9 leukemia cells transduced with scramble or Rab27a shRNA were harvested after 48 h of puromycin selection for western blot analysis. Numbers represent the densitometry quantification of protein levels normalized to ACTB. (D) MA9 cells described in (C) were treated with chloroquine at 10 μM for 24 h followed by ANXA5 and 7-AAD staining for apoptotic analysis.