Figures & data
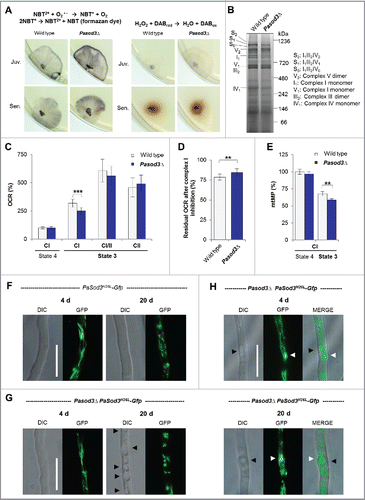
Figure 1. Increased superoxide level of Pasod3Δ leads to mitochondrial impairments. (A) Determination of superoxide and hydrogen peroxide in juvenile and senescent wild-type and Pasod3Δ strains (n = 8) by NBT and DAB staining. (B) BN-PAGE analysis of mitochondrial protein extracts from wild type and Pasod3Δ (n = 3). (C) Oxygen consumption rate (OCR) of Pasod3Δ and wild-type mitochondria (for each strain 4 mitochondrial preparations with 10 to 22 technical replicates were analyzed). (i) State 4 CI: addition of pyruvate and malate to assess complex I-dependent state 4 respiration; (ii) state 3 CI: same substrates as in (i) plus ADP to measure complex I-dependent state 3 respiration; (iii) state 3 CI/II: same as (ii) plus succinate to assess complex I/II-dependent state 3 respiration; (iv) state 3 CII: same as (iii) plus complex I inhibitor rotenone to determine complex II-dependent respiration. (D) Residual OCR after complex I inhibition with the specific inhibitor rotenone of Pasod3Δ compared with wild type (for each strain 3 mitochondrial preparations with 10 measurements). (E) Mitochondrial membrane potential (mtMP) determined by the mtMP-dependent accumulation of TMRM in the mitochondria (for each strain 2 biologic replicates with 6 technical replicates). (F)-(H) GFP-fluorescence microscopy of 4- and 20-d-old PaSod3H26L-Gfp vs. Pasod3Δ PaSod3H26L-Gfp. Black arrowhead indicates vacuoles, white arrowhead demonstrates ‘dot-like’ GFP aggregates in the proximity of vacuoles. Scale bar: 10 µm. (C) to (E) Error bars correspond to the standard deviation. DIC, differential interference contrast.

Figure 2. Functional autophagy is required for the healthy phenotype of Pasod3Δ. (A) Southern blot analysis of HindIII digested genomic DNA from wild type, Pasod3Δ, Paatg1Δ and Pasod3Δ Paatg1Δ by using a Ble- (phleomycin resistance), PaSod3- and PaAtg1-hybridization probe. (B) Survival curves of the wild type (n = 27), Paatg1Δ (n = 27; P < 0.001), Pasod3Δ (n = 25) and Pasod3Δ Paatg1Δ (n = 26; P < 0.001). (C) Relative mean life span of Paatg1Δ (n = 27), Pasod3Δ (n = 25) and Pasod3Δ Paatg1Δ (n = 26) resulting from the comparison of the mean life span of each strain with the mean life span of the wild type (n = 27, set to 100%). (D) Relative mean growth rates of Paatg1Δ (n = 27), Pasod3Δ (n = 25) and Pasod3Δ Paatg1Δ (n = 26) derived from the comparison of the mean growth rate of each strain with the mean growth rate of the wild type (n = 27, set to 100%). (E) Southern blot analysis of HindIII digested genomic DNA from wild type, Pasod3Δ, Gfp-PaAtg8 and Pasod3Δ Gfp-PaAtg8 using a PaAtg8 and PaSod3 hybridization probe, respectively. (F) and (G) LSFM of hyphae from 4- and 20-d-old wild-type and Pasod3Δ strains expressing Gfp-PaAtg8. The number of distinctive dots in the shown hyphal sections is indicated. (H) Quantification of autophagosomes of 4- and 20-d-old wild-type and Pasod3Δ strains expressing Gfp-PaAtg8 (n = 10). P values were determined between 4- and 20-d-old strains and between wild type and mutant of the same age. (C) and (D), (H) Error bars correspond to the standard error.

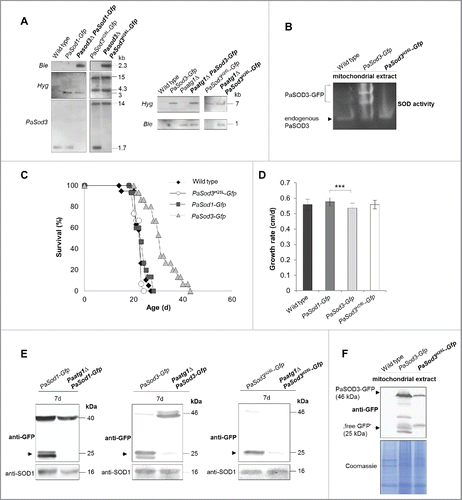
Figure 3. Generation and verification of autophagy- and mitophagy-reporter strains. (A) Southern blot analysis of HindIII digested genomic DNA validating the genetic constitution of wild type, PaSod1-Gfp, Pasod3Δ PaSod1-Gfp, PaSod3H26L-Gfp and Pasod3Δ PaSod3H26L-Gfp, as well as Paatg1Δ PaSod1-Gfp, Paatg1Δ PaSod3H26L-Gfp. In addition, Southern blot analysis of EcoRV-digested genomic DNA demonstrates the genetic constitution of Paatg1Δ PaSod3-Gfp, Paatg1Δ and PaSod3-Gfp, PaSod3H26L-Gfp and Paatg1Δ PaSod3H26L-Gfp. Ble-, Hyg- (hygromycin resistance) and PaSod3- hybridization probe were used as indicated. (B) ‘In-gel’ SOD3 enzyme activity assay from mitochondrial extracts of the wild type, PaSod3-Gfp and PaSod3H26L-Gfp. (C) Life span of monokaryotic wild type (n = 19) and PaSod1-Gfp (n = 15), PaSod3-Gfp (n = 15) and PaSod3H26L-Gfp (n = 15). P values were determined between the wild type and PaSod1-Gfp (P > 0.05), between the wild type and PaSod3-Gfp (P< 0.001) and between wild type and the PaSod3H26L-Gfp mutant (P > 0.05). (D) Growth rates of wild type (n = 19) and PaSod1-Gfp (n = 15), PaSod3-Gfp (n = 15) and PaSod3H26L-Gfp (n = 15). Error bars correspond to the standard deviation. (E) Western blot analysis of total protein extracts of PaSod1-Gfp vs. Paatg1Δ PaSod1-Gfp, PaSod3-Gfp vs. Paatg1Δ PaSod3-Gfp and PaSod3H26L-Gfp vs. Paatg1Δ PaSod3H26L-Gfp using a GFP-antibody. The protein amount of SOD1 served as a loading control. (F) Western blot analysis from mitochondrial extracts of the wild type, PaSod3-Gfp and PaSod3H26L-Gfp using an GFP-antibody. The Coomassie Blue-stained gel served as a loading control.

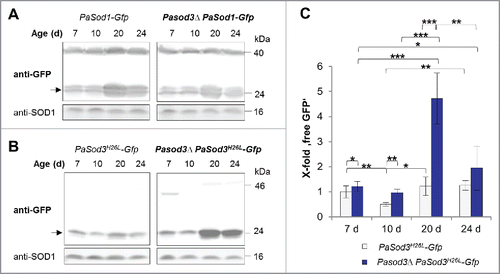
Figure 4. Mitophagy is induced during aging of Pasod3Δ. (A) Monitoring autophagy by western blot analysis of 7-, 10-, 20- and 24-d-old PaSod1-Gfp compared with Pasod3Δ PaSod1-Gfp. (B) Monitoring mitophagy by western blot analysis of 7-, 10-, 20- and 24-d-old PaSod3H26L-Gfp compared with Pasod3Δ PaSod3H26L-Gfp. (C) GFP protein levels of 7- (n = 10), 10- (n = 3), 20- (n = 6) and 24- (n = 3) d-old PaSod3H26L-Gfp and Pasod3Δ PaSod3H26L-Gfp normalized to the level of PaSOD1. Protein abundance in 7-d-old PaSod3H26L-Gfp was set to 1. Error bars correspond to the standard deviation. P values were determined between cultures of the same strain or between wild type and mutant of the same age by the paired Student t test.

Figure 5. Transcript levels of genes involved in the control of mitochondrial energy metabolism and biogenesis, are increased. (A) Transcriptome data of juvenile and senescent Pasod3Δ vs. wild type, demonstrated as a heatmap. Colors indicate relative expression of up- and downregulated transcripts of all genes, classified by Pa-number, with the relative transcription threshold to ≥ 3 and P-value of P ≤ 0.05. (B) GO enrichment analysis of transcriptome data of Pasod3Δ showing differential expression compared with the P. anserina wild type. All differentially expressed genes (Factor > 3; P < 0.05) were analyzed. GO terms with P < 1E-5 are shown. CC: Cellular Component; BP: Biological Process; C: Count (number of genes of respective GO term in the group [up- or downregulated]); S: Size (total number of P. anserina genes with the respective GO term).
![Figure 5. Transcript levels of genes involved in the control of mitochondrial energy metabolism and biogenesis, are increased. (A) Transcriptome data of juvenile and senescent Pasod3Δ vs. wild type, demonstrated as a heatmap. Colors indicate relative expression of up- and downregulated transcripts of all genes, classified by Pa-number, with the relative transcription threshold to ≥ 3 and P-value of P ≤ 0.05. (B) GO enrichment analysis of transcriptome data of Pasod3Δ showing differential expression compared with the P. anserina wild type. All differentially expressed genes (Factor > 3; P < 0.05) were analyzed. GO terms with P < 1E-5 are shown. CC: Cellular Component; BP: Biological Process; C: Count (number of genes of respective GO term in the group [up- or downregulated]); S: Size (total number of P. anserina genes with the respective GO term).](/cms/asset/6b8c687f-d17a-4236-86a9-36b9f7092ca1/kaup_a_1303021_f0005_c.gif)
Figure 6. Influence of oxidized proteins, membrane potential, mPTP and oxidative stress on mitophagy induction in Pasod3Δ. (A) ‘Oxy blot’ analysis of total protein extracts from wild type, Pasod3Δ, Pasod3Δ Paatg1Δ and Paatg1Δ (n = 3) Carbonyl groups of oxidized proteins derivatized to 2,4-dinitrophenylhydrazone (DNP-hydrazone) were detected with a DNP-specific antibody. The Coomassie Blue-stained gel after blotting served as a loading control. (B) Monitoring mitophagy during FCCP treatment (0, 5 and 15 µM) via western blot of PaSod3-Gfp. (C) Growth rates of wild type (n = 10) and Pasod3Δ (n = 11) treated with 0, 0.01 and 0.025 µg/ml cyclosporine A (CsA). Error bars correspond to the standard deviation. P values were determined between wild type and Pasod3Δ (2-tailed Mann-Whitney-Wilcoxon U test). (D) Life span of monokaryotic wild type (n = 10) and Pasod3Δ (n = 11) treated with 0, 0.01 and 0.025 µg/ml CsA. (E) Monitoring autophagy and mitophagy during paraquat treatment (60 µM) via western blot analysis of PaSod1-Gfp and PaSod3H26L-Gfp. (F) GFP protein levels of PaSod1-Gfp and PaSod3H26L-Gfp (n = 4) untreated (0 µM, set to 1) and treated (60 µM) with paraquat were normalized to the amount of proteins on the Coomassie Blue-stained gel. P values were determined between paraquat-untreated and treated cultures of each strain.

Figure 7. Mitohormetic response to oxidative stress depends on mitophagy. (A) Mean life span of 20 µM paraquat-treated wild type (n = 25) and Paatg1Δ (n = 12). (B) Relative mean life span of paraquat-treated (20 µM) wild type (n = 25) and Paatg1Δ (n = 12). (C) Mean life span of 80 µM paraquat-treated wild type (n = 25) and Paatg1Δ (n = 12). (D) Relative mean life span of 80 µM paraquat-treated wild type (n = 25) and Paatg1Δ (n = 12). (E) Relative mean growth rates of wild type (n = 25), Paatg1Δ (n = 12), Pasod3Δ (n = 20) and Pasod3Δ Paatg1Δ (n = 10) treated with 20 µM paraquat. The mean growth rate of the untreated wild type (n = 25) was set to 100% (baseline). (F) Relative mean life span of paraquat-treated (20 µM) wild type (n = 25), Paatg1Δ (n = 12) and Pasod3Δ compared with Pasod3Δ Paatg1Δ (n = 10). The mean life span of the untreated wild type (n = 25) was set to 100% (baseline). (G) Survival curves of the wild type (n = 25), Paatg1Δ (n = 12; P < 0.001), Pasod3Δ (n = 20) and Pasod3Δ Paatg1Δ (n = 10; P < 0.001) under 20 µM paraquat. (A) to (F) Error bars correspond to the standard deviation.

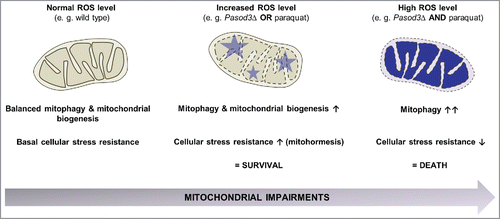
Figure 8. Stress-dependent role of mitophagy. In the wild type, coordination between mitophagy and mitochondrial biogenesis leads to a basal stress resistance under ‘normal’ ROS levels. When ROS is slightly increased as is demonstrated for example in the Pasod3 deletion mutant, mitochondrial function is partially impaired, leading to an induction of mitophagy and mitochondrial biogenesis to compensate impairments in ROS scavenging via a mitohormetic response. In contrast, when oxidative stress levels pass critical thresholds (e.g., Pasod3Δ treated with paraquat), mitophagy is further increased in response to enhanced mitochondrial impairments. In this situation mitophagy can no longer rescue the healthy phenotype and this leads to autophagic cell death.

