Figures & data
Figure 1. LC3-positive puncta accumulate upon overexpression of STX17ΔNTD. (A) Wild-type (WT) HeLa cells were transiently transfected with plasmids expressing the indicated STX17 fragments. Two d later, cells were fixed under growing conditions and analyzed by immuofluorescence microscopy using anti-LC3 and anti-MYC antibodies. Scale bars: 20 μm. (B) Quantification of the ratio of the total area of LC3-positive puncta to the total cellular area expressing the indicated STX17 variants. Cells showing significant MYC signal intensities (10% or more of the highest signal among all of the variants) were selected from 5 or 6 randomly selected regions and 18–46 cells were analyzed. Data represent mean ± SEM. Different letters indicate significant differences between MYC-tagged STX17 variants at p < 0.01 by one-way ANOVA followed by Tukey's test.
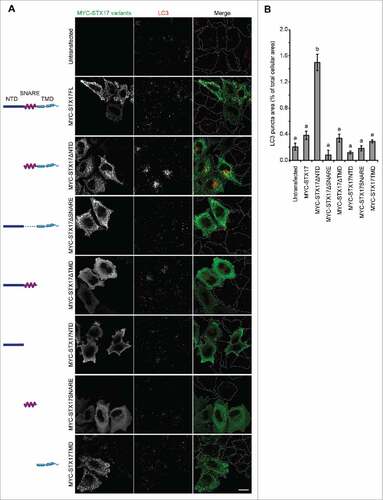
Figure 2. Overexpression of GFP-STX17FL causes accumulation of LC3-positive puncta. (A) WT HeLa cells were transiently transfected with the indicated plasmids. Two d later, cells were fixed under growing conditions and analyzed by immuofluorescence microscopy using anti-LC3 and anti-MYC antibodies. Scale bars: 20 μm; 2 μm in the magnified images (right). (B) Quantification was performed as in and 26–39 cells were analyzed. Different letters indicate significant differences between MYC- or MYC-GFP-tagged STX17 variants at p < 0.01 by one-way ANOVA followed by Tukey's test. The experiments were successfully performed twice.
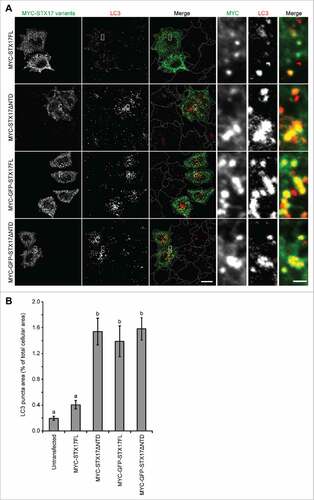
Figure 3. The dominant-negative effect of GFP-STX17ΔNTD and GFP-STX17FL can be controlled using the tetracyclin-inducible system in HeLa cells. (A) WT and TetON-GFPSTX17ΔNTD and TetON-GFPSTX17FL HeLa cells were cultured with or without DOX (1.5 μg/ml). Two d later, cells were cultured in regular or starvation medium for 1 h and analyzed by immunofluorescence microscopy using anti-LC3 antibody. Scale bars: 20 μm; 2 μm in insets. The experiments were successfully performed twice. (B) WT and TetON-GFPSTX17ΔNTD and TetON-GFPSTX17FL HeLa cells were cultured with or without DOX (1.5 μg/ml) for 3 or 6 d. Subsequently, cells were cultured in regular or starvation medium with or without 100 nM bafilomycin A1 for 2 h and analyzed by immunoblotting using the indicated antibodies.
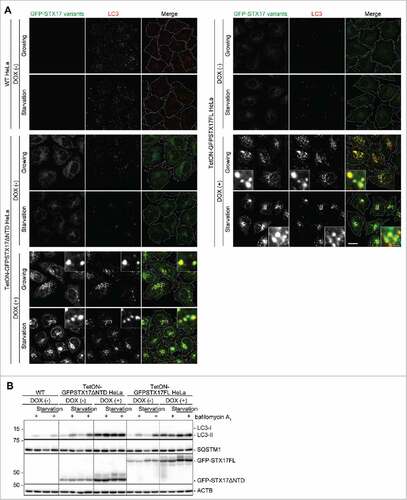
Figure 4. Accumulated LC3-positive structures did not colocalize with phagophore and lysosome markers in DOX-treated TetON-GFPSTX17ΔNTD and TetON-GFPSTX17FL HeLa cells. (A-C) TetON-GFPSTX17ΔNTD and TetON-GFPSTX17FL HeLa cells were cultured with DOX (1.5 μg/ml) for 2 d. Cells were cultured in regular (Gr) or starvation (St) medium for 1 h and analyzed by immunofluorescence microscopy using antibodies against RB1CC1 (A), WIPI2 (B), and LAMP1 (C). Colocalization analysis was performed as described in Materials and Methods. Each correlation plot is derived from 30–61 cells in 3 different fields of view. The mean Pearson's correlation coefficient values ± SEM are shown on the plots and the graphs. The intensities of GFP-STX17 variants are represented on the x-axis. Asterisks indicate significant differences between MYC-tagged STX17 variants at p < 0.01 by t-test. Scale bars: 10 μm; 2 μm in insets.
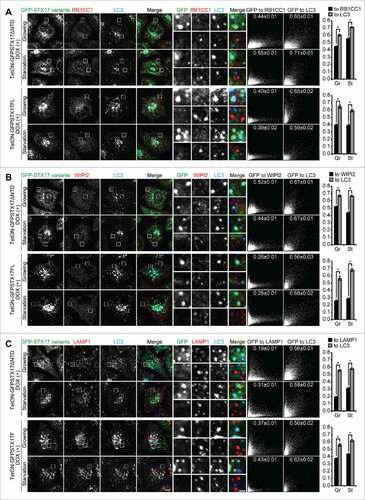
Figure 5. Undegraded autophagosomes but not phagophores or autolysosomes accumulate in TetON-GFPSTX17ΔNTD and TetON-GFPSTX17FL HeLa cells. TetON-GFPSTX17ΔNTD (top) and TetON-GFPSTX17FL (middle) HeLa cells were cultured with DOX (1.5 μg/ml) for 2 d. Wild-type (WT) HeLa cells were cultured in starvation medium with 100 nM bafilomycin A1 for 2 h (bottom). Cells were subjected to conventional electron microscopy analysis. Autophagosomes and autolysosomes are indicated by red arrowheads and arrows, respectively. Scale bars: 500 nm; 100 nm in insets. Representative images are shown.
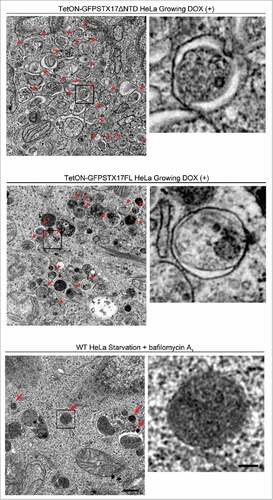
Figure 6. Purification of autophagosomes. (A-D) TetON-GFPSTX17ΔNTD HeLa cells stably expressing FLAG-LC3 were cultured in the absence (A, C) or presence (B, D) of 1.5 μg/ml DOX for 2 d. After separation by the OptiPrep membrane flotation method, each fraction was analyzed by immunoblotting (A, B). The LDH activity of each fraction was measured under nontreated (closed circle) and Triton X-100-treated (open circle) conditions. Insets show magnified images of fractions 2–5 (C, D). The experiments were successfully performed twice. (E) FLAG-LC3-enriched membranes were precipitated from light-density fractions (fractions [Fr.] 3 and 4) in the absence of detergent using anti-FLAG antibody-coated magnetic beads and analyzed by immunoblotting.
![Figure 6. Purification of autophagosomes. (A-D) TetON-GFPSTX17ΔNTD HeLa cells stably expressing FLAG-LC3 were cultured in the absence (A, C) or presence (B, D) of 1.5 μg/ml DOX for 2 d. After separation by the OptiPrep membrane flotation method, each fraction was analyzed by immunoblotting (A, B). The LDH activity of each fraction was measured under nontreated (closed circle) and Triton X-100-treated (open circle) conditions. Insets show magnified images of fractions 2–5 (C, D). The experiments were successfully performed twice. (E) FLAG-LC3-enriched membranes were precipitated from light-density fractions (fractions [Fr.] 3 and 4) in the absence of detergent using anti-FLAG antibody-coated magnetic beads and analyzed by immunoblotting.](/cms/asset/5de73a81-8d9c-4d52-875b-00c367ec13c2/kaup_a_1327940_f0006_b.gif)
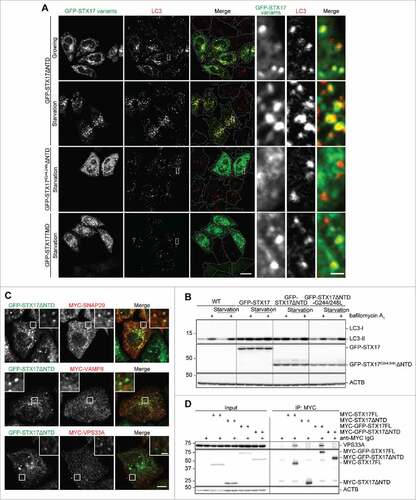
Figure 7. Localization of GFP-STX17ΔNTD on autophagosomes is necessary for the dominant-negative effect. (A) WT HeLa cells were transiently transfected with the indicated plasmids. Two d later, cells were cultured in regular or starvation medium for 1 h and analyzed by immunofluorescence microscopy using anti-LC3 antibody. Representative images of 5 randomly selected regions are shown. Scale bars: 20 μm; 2 μm in insets. (B) WT HeLa cells were transiently transfected with the indicated plasmids. Two d later, cells were cultured in regular or starvation medium with or without 100 nM bafilomycin A1 for 2 h and analyzed by immunoblotting using the indicated antibodies. (C) TetON-GFPSTX17ΔNTD HeLa cells were transiently transfected with a plasmid expressing MYC-SNAP29 or MYC-VAMP8, or stably transfected with a plasmid encoding MYC-VPS33A. Cells were fixed and stained using anti-MYC antibody and analyzed by immunofluorescence microscopy. Representative images of 5 randomly selected regions are shown. Scale bars: 10 μm; 2 μm in insets. (D) HEK293T cells were stably transfected with the indicated plasmids. Cells were lysed and separated into 2 samples, which were immunoprecipitated with (indicated with “+”) and without anti-MYC antibody in combination with protein G-Sepharose, followed by immunoblotting using anti-VPS33A, anti-MYC, and anti-ACTB antibodies.