
Figures & data
Figure 1. Inhibition of MTOR activity caused thymus atrophy. (A) Representative picture of thymi from mice treated with rapamycin (RPM) or carboxymethyl cellulose sodium (CMC) for 7 d. Scale bar: 5 mm. The ratio of thymus weight to body weight (B) and thymocyte number (C) of control (n = 4) and RPM-treated mice (n = 5). (D) Representative flow cytometry data and frequency of TECs in control mice (n = 4) and RPM-treated mice (n = 5). TECs were defined as PTPRC− EPCAM+ cells. (E) Cell numbers of TECs in control mice (n = 4) and RPM-treated mice (n = 5). Representative FACS plots (F) and frequency (G) of mTECs and cTECs in control mice (n = 4) and RPM-treated mice (n = 5). mTECs were defined as PTPRC− EPCAM+ UEA-1+ ENPEP− cells and cTECs as PTPRC− EPCAM+ UEA-1− ENPEP+ cells. (H) Absolute cell numbers of mTECs and cTECs in control mice (n = 4) and RPM-treated mice (n = 5). Representative FACS plots (I) and quantification (J) of mTECs from control mice (n = 4) and RPM-treated mice (n = 5) for the staining of MHC II, CD40, CD80 and AIRE. (K) Absolute cell numbers of MHC IIhigh, CD40+, CD80+ and AIRE+ mTECs isolated from control mice (n = 4) and RPM-treated mice (n = 5). FACS plots (L) and frequency (M) of mTECs with the phenotype of CD80+ AIRE+ from control mice (n = 4) and RPM-treated mice (n = 5). (N) Absolute cell numbers of CD80+ AIRE+ mTECs from control mice (n = 4) and RPM-treated mice (n = 4). **P<0.01 and ***P<0.001 compared with the control group.
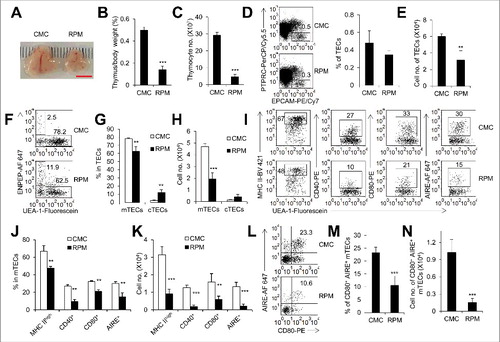
Figure 2. The development of embryonic thymi was blocked with TEC-specific deletion of Mtor. (A) Representative picture of embryonic thymi from WT and Mtor cKO mice embryos. Scale bar: 1 mm. (B) Absolute cell numbers of embryonic thymi from WT (n = 4) and Mtor cKO embryos (n = 4). (C) Representative flow cytometry plots and frequency of TECs in control (n = 4) and Mtor cKO embryo (n = 4) thymi. (D) Absolute cell numbers of TECs in control (n = 4) and Mtor cKO embryo (n = 4) thymi. (E) Representative flow cytometry data and frequency of mTECs and cTECs from thymi of WT (n = 4) and Mtor cKO embryos (n = 4). (F) Absolute cell numbers of mTECs and cTECs from control (n = 4) and Mtor cKO embryo (n = 4) thymi. (G) FACS plots and quantification of MHC IIhigh TECs from the thymi of control (n = 4) and Mtor cKO embryos (n = 4). (H) Absolute cell numbers of MHC IIhigh TECs from the thymi of control (n = 4) and Mtor cKO embryos (n = 4). (I) FACS plots and quantification of LY75+ cells within TECs from control (n = 4) and Mtor cKO embryo (n = 4) thymi. (J) Absolute cell numbers of LY75+ TECs from control (n = 4) and Mtor cKO embryo (n = 4) thymi. *P<0.05, **P<0.01 and ***P<0.001 compared with control group.
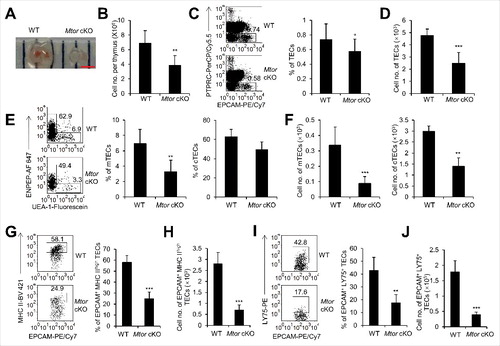
Figure 3. TEC-specific deletion of Mtor caused severe thymic atrophy. (A) Representative thymus pictures of 2-wk-old Mtor cKO and wild-type littermate control mice. Scale bar: 5 mm. (B) The ratio of thymus weight to body weight and total thymocyte numbers in 2-wk-old WT (n = 7) and Mtor cKO mice (n = 8). (C) H&E staining of the thymi from 2-wk-old WT and Mtor cKO mice is shown. Scale bars: 1000 μm. (D) Frozen thymic sections derived from 2-wk-old Mtor cKO mice and littermates for the expression of KRT5 (red) and KRT8 (green). Scale bars: 300 μm. (E) Flow cytometric profiles and frequency of TECs (PTPRC− EPCAM+) isolated from 2-wk-old Mtor cKO mice (n = 5) and WT littermates (n = 7). (F) Absolute cell numbers of TECs isolated from 2-wk-old Mtor cKO mice (n = 5) and littermates (n = 7). (G) Representative flow cytometry data and frequency of mTECs and cTECs from 2-wk-old WT (n = 14) and Mtor cKO mice (n = 11). (H) Absolute cell numbers of mTECs and cTECs from 2-wk-old WT (n = 14) and mutant mice (n = 11). (I) Flow cytometric staining of MHC II, AIRE, CD80 and CD40 within mTECs from 2-wk-old WT (n = 5) and Mtor cKO mice (n = 5). (J) Frequency of MHC IIhigh, CD80+, CD40+ and AIRE+ mTECs from 2-wk-old WT (n = 5) and Mtor cKO mice (n = 5). (K) Absolute cell numbers of MHC IIhigh, CD80+, CD40+ and AIRE+ mTECs from 2-wk-old WT (n = 5) and Mtor cKO mice (n = 5). *P<0.05, **P<0.01 and ***P<0.001 compared with control group.
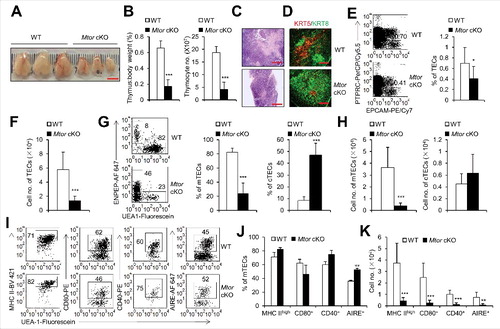
Figure 4. TEC-specific deletion of Mtor caused increased autophagy and attenuation of WNT signaling. (A) Representative FACS plots and frequency of TECs for the staining of MTS24 in 2-wk-old WT (n = 4) and Mtor cKO mice (n = 4). (B) Absolute cell numbers of MTS24+ TECs from 2-wk-old WT (n = 4) and Mtor cKO mice (n = 4). (C) 1-wk-old Mtor cKO mice (n = 3) and littermate controls (n = 3) were injected intraperitoneally with BrdU (BD Biosciences, 1 mg per mouse). Twenty-four h after injection, the nuclear staining of BrdU in mTECs and cTECs were shown. (D) The frequency of BrdU+ mTECs and cTECs. (E) Representative pictures of cultured primary TECs from newborn WT and Mtor cKO mice. Scale bars: 200 μm. (F) Representative flow cytometry plots and frequency of TECs for the staining of CYTO-ID in WT (n = 4) and Mtor cKO mice (n = 4). (G) Representative flow cytometry plots and frequency of mTECs and cTECs for the staining of CTNNB1 in WT (n = 3) and Mtor cKO mice (n = 3). (H) Western blot results for the expressions of LC3, DVL2, CTNNB1 and phosphorylated CTNNB1 in 1C6 mTEC cells in the absence (left line) or presence (right line) of 2 μM RPM for 24 h. The expression of these proteins under RPM treatment was normalized to the ones without RPM treatment. (I) Representative FACS plots for the expression of UEA-1 in TECs of WT (n = 4) and Mtor cKO (n = 3) E16.5 thymi treated with 1.5 mM 3-MA for 4 d. (J) Statistical analysis of the frequency of mTECs in TECs of WT (n = 4) and Mtor cKO (n = 3) E16.5 thymi treated with 1.5 mM 3-MA for 4 d. (K and L) E16.5 WT and Mtor cKO thymi were treated with 1.5 mM 3-MA for 4 d and the expression of CTNNB1 in KRT5+ mTECs was detected by immunofluorescence. Scale bars: 50 μm. **P<0.01 and ***P<0.001 compared with control group.
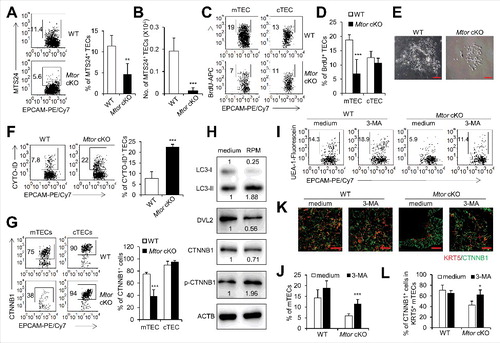
Figure 5. Development of thymocytes was blocked in Mtor cKO mice. (A) Representative flow cytometry profiles of thymocytes for the expression of CD4 and CD8 derived from 2-wk-old Mtor cKO mice (n = 6) and littermate controls (n = 6). (B) Statistical analysis of thymocytes for distribution of CD4 SP, CD8 SP, DP and DN from 2-wk-old Mtor cKO mice (n = 6) and littermate controls (n = 6). (C) Absolute cell numbers of CD4 SP, CD8 SP, DP and DN thymocytes from 2-wk-old Mtor cKO mice (n = 6) and littermate controls (n = 6). (D) Flow cytometry profiles of CD4+ CD8− TCRBhigh or CD4− CD8+ TCRBhigh thymocytes for the expression of CD24 and SELL. (E) Frequency of mature thymocytes of 2-wk-old Mtor cKO mice (n = 4) and littermate controls (n = 4). Mature thymocytes are CD24low SELLhigh TCRBhigh CD4+ CD8− or CD4− CD8+. Flow cytometry profiles (F), frequency (G) and absolute numbers (H) of thymic Treg cells from 2-wk-old WT (n = 4) and Mtor cKO mice (n = 4). (I) Flow cytometry profiles of thymic Treg precursors (CD4+ CD8− IL2RA+ FOXP3−) in 2-wk-old WT (n = 7) and Mtor cKO mice (n = 7). (J) The ratio of thymic CD4+ CD8− IL2RA+ FOXP3− Treg precursors to mature CD4+ CD8− IL2RA+ FOXP3+ Treg cells in 2-wk-old WT (n = 7) and Mtor cKO mice (n = 7). Flow cytometry profiles (K) and the frequency (L) of SELL+ CD45RBint recent thymic emigrants (RTEs) in the spleen of 4-wk-old WT (n = 3) and Mtor cKO mice (n = 3). After gating on CD4+ cells, RTEs are SELL+ CD45RBint. Flow cytometry plots (M), frequency (N) and absolute cell numbers (O) of CD4+ and CD8+ T cells in the spleen of 4-wk-old WT (n = 3) and Mtor cKO mice (n = 3). *P<0.05, **P<0.01 and ***P<0.001 compared with control group.
Figure 6. TEC-specific deletion of Mtor caused severe autoimmune disease. (A) Expression of the indicated TRAs in Mtor cKO mice (black bars), relative to expression found in WT littermates (white bars). (B) Flow cytometry plots of splenic CD4+ or CD8+ T cells for the cell surface staining of CD44 and SELL from 4-wk-old WT (n = 4) and Mtor cKO mice (n = 4). (C) Frequency of naïve (SELL+ CD44−) and activated (CD44+) cells in splenic CD4+ or CD8+ T cells from 4-wk-old WT (n = 4) and Mtor cKO mice (n = 4). (D) The body weight curve of WT and Mtor cKO mice at the indicated age. (E) Paraffin-embedded sections of organs from 6- to 8-mo-old WT (n = 4) and Mtor cKO mice (n = 4) were stained with H&E and evaluated for the presence of infiltrates by light microscopy. Individual scores (n = 6 for WT; n = 6 for Mtor cKO) and means (bars) are indicated. Scale bars: 200 μm. (F) Sera of 6- to 8-mo-old WT (n = 4) and Mtor cKO (n = 4) mice were used to stain HEp-2 cells, and the presence of antinuclear antibodies (ANAs) was revealed by anti-mouse IgG-Alexa Fluor 488 antibody and fluorescence microscopy. Scale bars: 200 μm. (G) Tissue-reactive autoantibodies in the sera of 6- to 8-month-old WT (n = 4) and Mtor cKO mice (n = 4) were examined using various tissue sections of rag2−/− mice. *P<0.05, **P<0.01 and ***P<0.001 compared with control group. Scale bars: 200 μm.
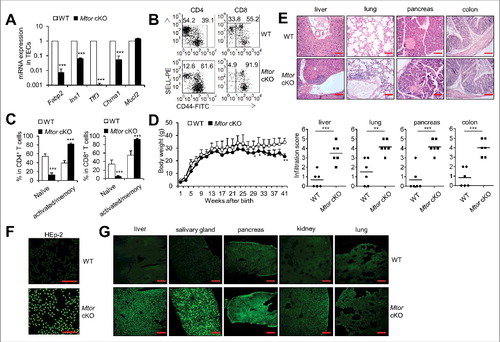
Table 1. The list of primers used in qPCR assays.