Figures & data
Figure 1. GEnCs exhibit high autophagic activity. In vivo evaluation of the autophagic flux among the different cell lineages in the kidney during the fasted state. (A to C) Representative electron micrographs of GEnCs (A), PTECs (B), and podocytes (C) of 8-wk-old WT mice that were subjected to 24 h of starvation with or without chloroquine administration 6 h before euthanasia (n = 3 in each group). Arrows indicate autophagosomes or autolysosomes. The lower panels show a magnification of the indicated areas (white squares) in the upper panels. Bars: 1 μm. (D) Quantification of the number of autophagosomes or autolysosomes per cell among GEnCs, PTECs, or podocytes. For each condition, at least 10 cells were examined in each mouse. Data are provided as the mean ± SD. NS, not significant. Statistically significant differences (**P < 0.01 versus the conditions without chloroquine administration) are indicated.
Figure 2. Evidence of autophagy deficiency in the ECs of atg5-cKO mice. (A to C) SQSTM1 accumulation in kidney ECs of atg5-cKO mice. Representative images of the immunofluorescence analysis using 8-wk-old Atg5F/+ ;Tek-Cre+;EGFP-ChAT (upper) and atg5-cKO;EGFP-ChAT (lower) mice. Sections containing glomeruli (A), peritubular capillaries (B), and renal small arteries (C) were immunostained for SQSTM1 (red) and for 4’, 6-diamidino-2-phenylindole (DAPI; blue) as counterstaining. (A) The right panels show a magnification of the indicated areas (white squares) in the left panels. Arrowheads indicate SQSTM1-positive aggregates localized in GFP-positive ECs of atg5-cKO;EGFP-ChAT mice. Bars: 20 μm. (D) Western blot analysis using isolated glomeruli from 4-wk-old atg5-cKO mice and their Atg5-CTRL littermates. (E and F) Densitometric quantification of the levels of ATG5 protein (E) and the conversion of MAP1LC3B-I to MAP1LC3B-II (F). n = 3 in each group. Data are provided as the mean ± SD. Statistically significant differences (**P < 0.01 versus the Atg5-CTRL mice) are indicated.
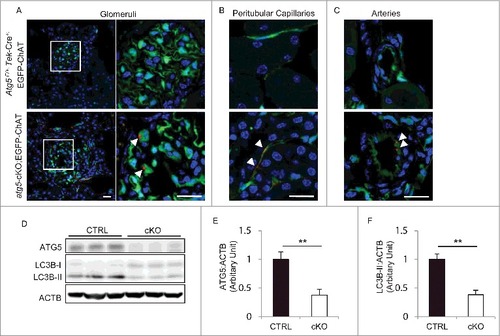
Figure 3. Glomerular abnormalities of atg5-cKO mice. Representative images of PAS staining (A), electron micrographs (B), and immunohistochemical analysis for PECAM1 (C) of glomeruli from 4- and 8-wk-old atg5-cKO and Atg5-CTRL mice (n = 4 to 6 in each group). (A) Distended capillary loops (arrows). (B) Segmental loss of glomerular endothelial fenestra (arrowhead) accompanied by foot process effacement of podocytes (arrow) adjacent to the transformed ECs. The right panels show a magnification of the indicated areas (white squares) in the left panels. Bars: 20 μm (A and C) and 1 μm (B). Plasma UN and creatinine, urinary albumin/creatinine ratio (D), and blood pressure (E) of 4- (D) and 6- (E) wk-old atg5-cKO and Atg5-CTRL mice are shown. n = 6 for plasma UN and creatinine; n = 9 to 14 for urinary albumin/creatinine ratio; and n = 3 or 4 (E) in each group. Data are provided as the mean ± SD. NS, not significant. SBP, systolic blood pressure; DBP, diastolic blood pressure.
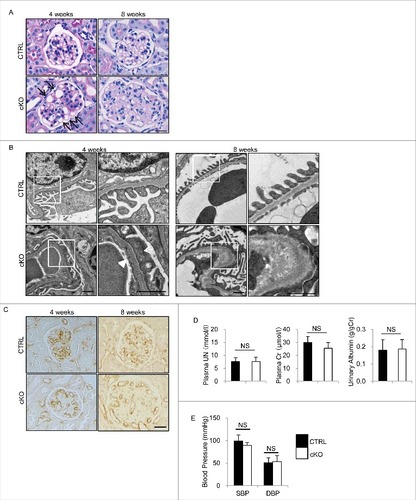
Figure 4. Accumulation of ROS in the glomeruli of atg5-cKO mice. (A) Representative images of the immunohistochemical analysis for dityrosine in kidney sections from 4- or 8-wk-old Atg5-CTRL (upper) and atg5-cKO (lower) mice. Small arteries are indicated with arrowheads. The lower panels show a magnification of the indicated areas (black squares) in the upper panels. Bars: 20 μm. (B) Western blot analysis for dityrosine, nitrotyrosine, and 4-HNE using isolated glomeruli homogenates from 8-wk-old atg5-cKO mice and their Atg5-CTRL littermates (n = 3 in each group).
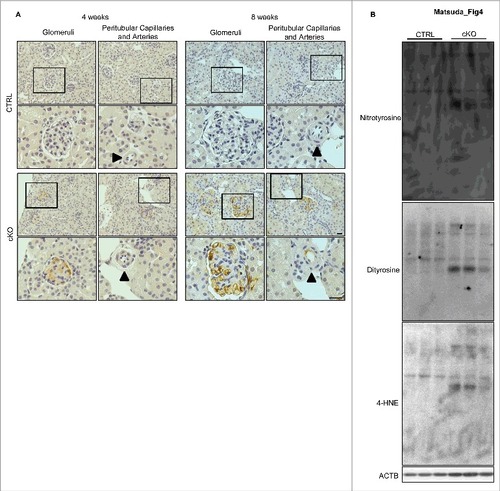
Figure 5. Long-term effects of autophagy deficiency in GEnCs. The long-term effects of autophagy deficiency in GEnCs were investigated in the Atg5-CTRL and atg5-cKO mice rescued by BMT at 4 wk of age (Atg5-CTRL recipients and atg5-cKO recipients, respectively). The blood UN (A), urinary albumin:creatinine ratio (B), body weight (C), peripheral blood cell counts (D), Kaplan-Meier survival curves (E), representative images of PAS staining (F), quantification of the ratio of sclerotic glomeruli per total glomeruli (G), and representative images of Masson-trichrome staining (H), immunostaining for ADGRE1 (I), electron micrographs of glomeruli (J), immunostaining for dityrosine (K), blood pressure (L) of mice at the indicated ages are shown. (A and B) n = 3 for 6-mo-old Atg5-CTRL recipients; n = 22 to 25 for 12-mo-old Atg5-CTRL recipients; n = 4 or 5 for 6-mo-old atg5-cKO recipients; and n = 11 or 12 for 12-mo-old atg5-cKO recipients. (C and D) n = 14 to 16 for Atg5-CTRL recipients; and n = 7 or 8 for atg5-cKO recipients. (G) n = 14 for Atg5-CTRL recipients; and n = 7 for atg5-cKO recipients. (L) n = 5 to 7 for Atg5-CTRL and atg5-cKO recipients, respectively. Data are provided as the mean ± SD. NS, not significant. Statistically significant differences (*P < 0.05, **P < 0.01 versus the Atg5-CTRL recipients) are indicated. (H to K) The right panels show a magnification of the indicated areas (black or white squares) in the left panels. Bars: 20 μm (F, H, I, and K) and 1 μm (J). SBP, systolic blood pressure; DBP, diastolic blood pressure.
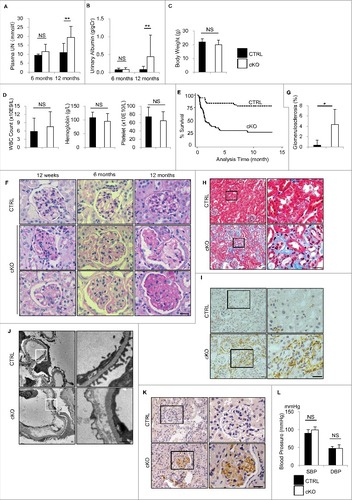
Table 1. Biochemical analysis of blood from endothelial-specific autophagy-deficient mice rescued by BMT
Figure 6. Endothelial-specific autophagy-deficient mice exhibit GEnC injury. Representative images of staining for ICAM1 (A) and colloidal iron (B) in the Atg5-CTRL and atg5-cKO mice at the indicated ages after rescue by BMT at 4 wk of age (Atg5-CTRL recipients and atg5-cKO recipients, respectively). Bars: 20 μm.
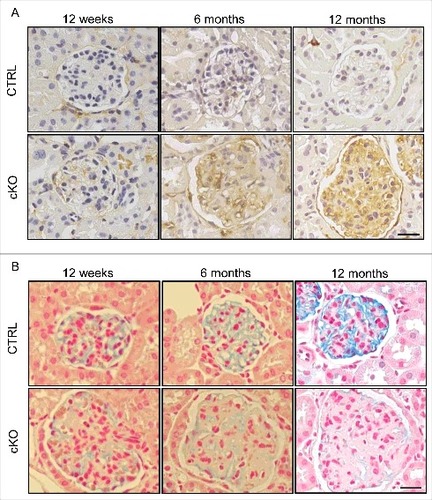
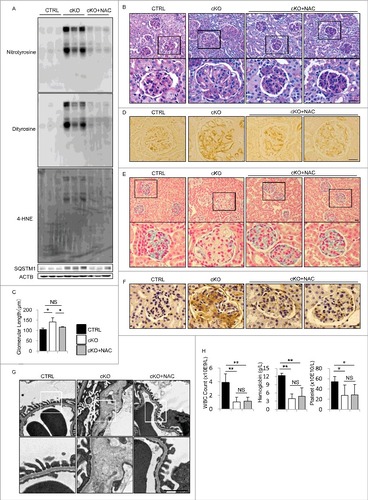
Figure 7. Administration of NAC alleviates the abnormalities of endothelial-specific autophagy-deficient mice. (A) Western blot analysis for nitrotyrosine, dityrosine, 4-HNE, and SQSTM1 using kidney cortex lysates from 8-wk-old atg5-cKO mice, atg5-cKO mice with NAC administration (atg5-cKO+NAC), and their Atg5-CTRL littermates. (B, D to H) Representative images of PAS staining (B), immunohistochemical analysis for PECAM1 (D), colloidal iron staining (E), immunohistochemical analysis for ICAM1 (F), electron micrographs (G), and peripheral blood cell counts (H) in the glomeruli of 8-wk-old atg5-cKO, atg5-cKO+NAC, and Atg5-CTRL mice. In (B), (E), and (G), the lower panels show a magnification of the indicated areas (black or white squares) in the upper panels. (C) For each condition, the diameter of the glomeruli was calculated from at least 20 glomeruli in each mouse. n = 3 (A, B, D to G); 4 (C); and 4 to 7 (H) in each group. Data are provided as the mean ± SD. NS, not significant. Statistically significant differences (*P < 0.05, **P < 0.01 versus the Atg5-CTRL or atg5-cKO+NAC mice) are indicated. Bars: 20 μm (B, D to F) and 1 μm (G).