Figures & data
Figure 1. Deteriorated function, remodeling and early death in HSPB6S10F mice upon aging. (A), Ejection fraction; (B), Fractional shortening; (C), Sample M-mode echocardiograms of HSPB6S10F and NTG mice at age of 16 mo; (D), Left ventricular end systolic volume (LVESV); (E), Left ventricular end diastolic volume (LVEDV): n = 6 for NTG, and 5 for HSPB6S10F mice; (F), Kaplan–Meier survival curve in HSPB6S10F mice versus NTG mice: n = 19 for NTG, and 21 for HSPB6S10F TG mice. Values represent means ± SEM; *P < 0.05 vs NTG.
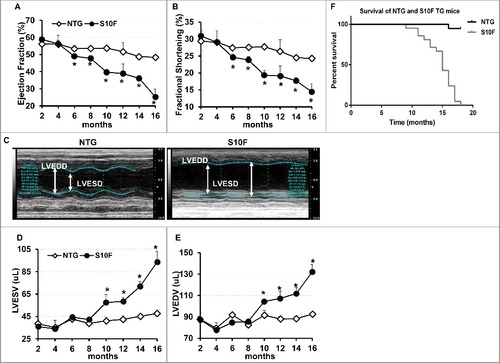
Figure 2. Increased hypertrophic remodeling and fibrosis in HSPB6S10F aging hearts. (A), Hematoxylin and eosin staining of the mouse hearts from NTG and HSPB6S10F mice at ages of 2, 8, and 14 mo, scale bar = 5 mm; (B and C), Ratios of HW:BW and LW:BW in HSPB6S10F mice versus NTG mice: n = 6 for NTG and 6 for HSPB6S10F mice; (D), Immunostaining of heart sections from 2, 8 and 14-mo-old NTG and HSPB6S10F mice with fluorescence-labeled wheat germ agglutinin, scale bars = 50 μm; (E), Analysis of individual myocyte size using ImageJ (National Institutes of Health). The mean myocyte area was evaluated by measurement of 300 cells per heart: n = 4 hearts for NTG, and 4 hearts for HSPB6S10F mice; (F and G), Ventricular mRNA levels of natriuretic peptide A (Nppa) and Atp2a2 in 2, 8, and 14-mo-old NTG and HSPB6S10F mice: n = 4 hearts for NTG, and 4 hearts for HSPB6S10F; (H), Representative sections of Masson Trichrome-stained cardiac sections from 2, 8, and 14-mo-old NTG and HSPB6S10F mice, scale bars = 100 μm. Values represent means ± SEM; *: P < 0.05, vs NTG.
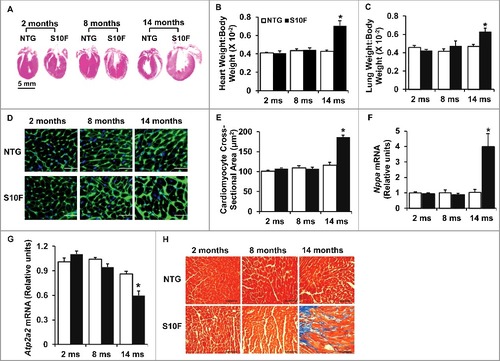
Figure 3. Increased cardiomyocyte apoptosis in aging HSPB6S10F hearts. (A), Triple-staining with an ACTA2 antibody (red, to reveal cardiomyocyte), DAPI (blue, to reveal all nuclei) and TUNEL (bright green, to determine apoptosis) in NTG or HSPB6S10F cardiomyocytes at 2, 8 and 14 mo of age (arrows indicate TUNEL-positive nuclei), scale bars = 50 μm; (B), Quantitative analysis of the numbers of TUNEL-positive nuclei in NTG and HSPB6S10F hearts: n = 4 hearts for NTG, and 4 hearts for HSPB6S10F, with 3 sections from each heart; (C), Increased CASP3 activation in 2, 8 and 14-mo-old HSPB6S10F mice. CASP3 activity was measured in heart homogenates from NTG and HSPB6S10F hearts using CASP3 Activity Assay Kit: n = 7 hearts for NTG and 7 hearts for HSPB6S10F. Values represent means ± SEM; *: P < 0.05, vs NTG.
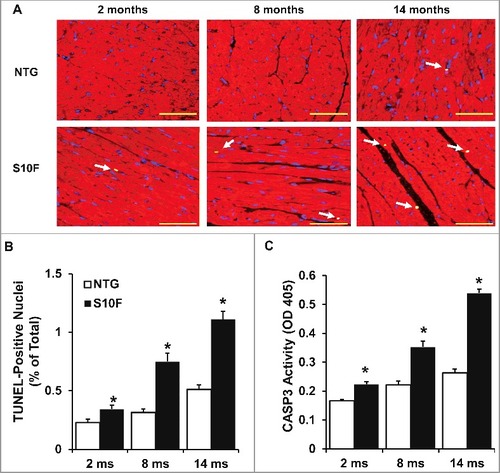
Figure 4. Impaired autophagy activity is associated with reduced BECN1 protein levels in HSPB6S10F hearts. (A), Representative immunoblots of LC3A/B-I and LC3A/B-II using calsequestrin (CASQ1/2) as a loading control; (B), Quantitative analysis of LC3A/B-II; n = 4 hearts for NTG and 4 hearts for HSPB6S10F; (C and D), Autophagy flux: (C), Western blots of LC3A/B-I and LC3A/B-II, as well as CASQ1/2 in mice that were i.p. injected with chloroquine (CQ, 50 mg/kg) or sterile saline (Vehicle) for 4 h before sacrifice; (D), Autophagic flux data that were analyzed and expressed as mean ± SEM. *: P < 0.05, vs NTG-Vehicle; #: P < 0.05, vs. NTG-Chloroquine; n = 6 hearts for each group; (E), Representative immunoblots of BECN1 and CASQ1/2; (F), Quantitative analysis of protein levels of BECN1; n = 6 hearts for NTG, and 6 hearts for HSPB6S10F; Values represent means ± SEM; *: P < 0.05, vs NTG; (G), Electron microscopy revealed impaired autophagy in HSPB6S10F heart tissue. White arrows denote typical autophagosomes; (H), Representative immunoblots of LC3A/B-I, LC3A/B-II, BECN1 and glyceraldehyde-3-phosphate dehydrogenase (GAPDH); (I and J), Quantitative analysis of protein levels of BECN1 and LC3A/B-II; n = 6 hearts for each group; Values represent means ± SEM; *: P < 0.05, vs GFP-NTG; #: P < 0.05, vs BECN1-NTG; (K), Representative images of cardiomyocyte apoptosis by Hoechst staining in each group. The apoptotic cells were indicated by the arrows, scale bars = 50 μm; (L), Normalized percentage of apoptotic cells per total number of cardiac cells in each group. n = 4 hearts for NTG and 4 hearts for HSPB6S10F. Values represent means ± SEM; *: P < 0.05, vs GFP-NTG; #: P < 0.05, vs GFP-HSPB6S10F.
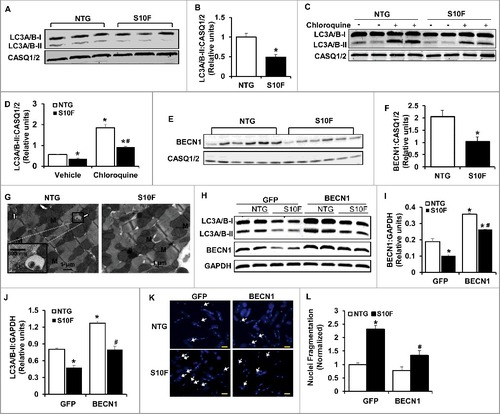
Figure 5. BECN1 protein reduction is attributed to the ubiquitin-proteosomal degradation pathway. (A), Ventricular mRNA levels of Becn1 in HSPB6S10F hearts were not altered: n = 3 hearts for NTG and 3 hearts for HSPB6S10F; (B), Proteasomal inhibitor, Bortezomib, restored BECN1 levels in HSPB6S10F-overexpressing cells (Con: control, Bor: Bortezomib); (C), Quantification of BECN1 levels in NTG and HSPB6S10F cardiomyocytes with/without Bortezomib treatment: n = 5 hearts for NTG and 5 hearts for HSPB6S10F; (D), Ubiquitination of BECN1 was enhanced in HSPB6S10F hearts: n = 4 hearts for NTG and 4 hearts for HSPB6S10F; (E to G), Enhanced BECN1 ubiquitination is associated with reduced interaction of HSPB6 with BECN1. (E), Reduced interaction of HSPB6 with BECN1 in HSPB6S10F hearts: n = 4 hearts for NTG, and 4 hearts for HSPB6S10F; (F), left panel: SDS-gel stained with Coomassie Blue showing the purified GST-HSPB6 WT and GST-HSPB6S10F; right panel: GST affinity-isolation assay showing reduced protein levels of BECN1 associated with GST-HSPB6S10F; (G), Quantification of protein levels of BECN1 binding to GST-HSPB6 WT or GST-HSPB6S10F: 3 independent experiments were performed. Values represent means ± SEM; *: P < 0.05, vs NTG or HSPB6 WT.
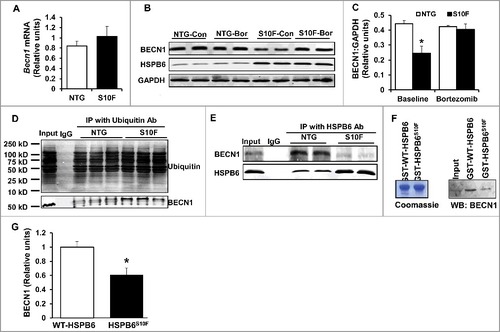
Figure 6. Acute overexpression of HSPB6 WT and HSPB6S10F in adult rat cardiomyocytes and examination of the expression and ubiquitination levels of BECN1. (A to C), HSPB6 WT increased BECN1 protein levels and reduced its ubiquitination, whereas, expression of BECN1 was decreased and its ubiquitination was increased in HSPB6S10F cardiomyocytes: 4 independent experiments were performed using 4 adult rat hearts. Values represent means ± SEM; *: P < 0.05, vs GFP; #: P < 0.05, vs HSPB6S10F; (D and E), The ability of BECN1 to interact with HSPB6 is independent of its ubiquitination. (D), PYR-41 (ubiquitin-activating enzyme E1 inhibitor) abolished BECN1's ubiquitination (+: PYR-41 treatment, -: PBS control); (E), Decreased interaction of HSPB6 with BECN1 in HSPB6S10F cardiomyocytes in the presence of PYR-41: 4 independent experiments were performed using 4 adult rat hearts.
Figure 7. HSPB6 competes with BCL2 binding to BECN1. (A and B), Reciprocal coimmunoprecipitations with the HSPB6 antibody and the BECN1 antibody revealed an interaction between HSPB6 and BECN1 in both NTG and HSPB6 WT TG hearts; (C to E), Recombinant human BECN1 protein was subject to a competitive ELISA containing increasing amounts of HSPB6 and BCL2, which revealed a competitive binding of HSPB6 and BCL2 with BECN1. BSA was used as a control. (C), A diagram for competitive ELISA to detect protein-protein interaction. High-binding 96-well ELISA plates were coated overnight with recombinant human BECN1 in carbonate buffer. Purified recombinant human BCL2 (D) or HSPB6 (E), as well as increasing amounts of HSPB6 (D) or BCL2 (E), were added and incubated for 2 h followed by 3 washes in PBST. Mouse monoclonal anti-BCL2 (D) or anti-HSPB6 (E) was used as a detection antibody and incubated for 2 h. Finally, tetramethylbenzidine substrate reagent was added, and absorbance was determined by a microplate reader at 450 nm. Three independent experiments were performed, values represent means ± SEM; *: P < 0.05, vs BSA; (F and G), Immunoprecipitation studies using BCL2 antibody as the bait and probed with BECN1 antibody in heart homogenates from HSPB6S10F TG mice and HSPB6 WT TG mice respectively, with NTG mice as controls. (F), Increased interaction of BECN1 with BCL2 in HSPB6S10F hearts; (G), Abolished interaction of BECN1 with BCL2 in HSPB6 WT hearts; 4 independent experiments were performed using 4 hearts for each group.
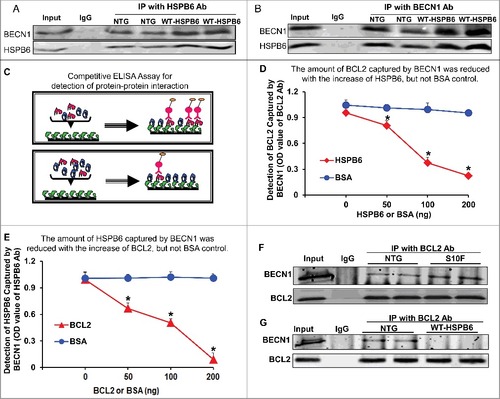
Figure 8. Overexpression of HSPB6 WT in the murine heart activates autophagic flux. (A), Representative immunoblots for determining the expression of HSPB6, LC3A/B-I/II and BECN1 in NTG and HSPB6 WT hearts; (B), Quantitative results of immunoblots: values are expressed as the mean ± SEM, n = 3 hearts for NTG and 3 hearts for HSPB6 WT, *: P < 0.05, vs NTG; (C), Quantification of autophagic flux by cadaverine dye-binding assay. Mice were i.p. injected with chloroquine (CQ) for 4 h and cadaverine dye-binding analysis showed that autophagy levels were significantly increased in HSPB6 WT hearts treated with both saline (Vehicle) and CQ, compared to NTG hearts; (D and E), Increased autophagy flux in HSPB6 WT hearts: (D), Representative western blots of LC3A/B-I and LC3A/B-II with CASQ1/2 as loading control; (E), Autophagic flux data expressed as the means ± SEM. n = 5 hearts for each group; *: P < 0.05, vs NTG-Vehicle; #: P < 0.05, vs. NTG-CQ; (F), Electron microscopy reveals autophagosomes in myocytes isolated from NTG and HSPB6 WT hearts. Black arrows: autophagosomes; (G), Quantitative results of the number of autophagosomes in NTG and HSPB6 WT cardiomyocytes. Ten fields from cardiomyocytes of 3 different hearts for each group were counted; (HSPB6 is colocalized with LC3A/B labeled autophagosome in neonatal rat cardiomyocytes. The GFP-HSPB6 fused plasmid cotransfected neonatal cardiomyocytes with the mcherry-fused LC3A/B plasmid and 48 h later, cells were examined under confocal fluorescence microscopy. There was colocalization of HSPB6 (green) with LC3A/B (red), scale bars = 20 μm. Three independent experiments were performed and values represent means ± SEM; *: P < 0.05, vs NTG.
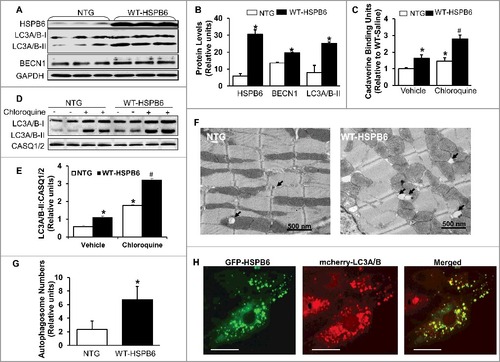
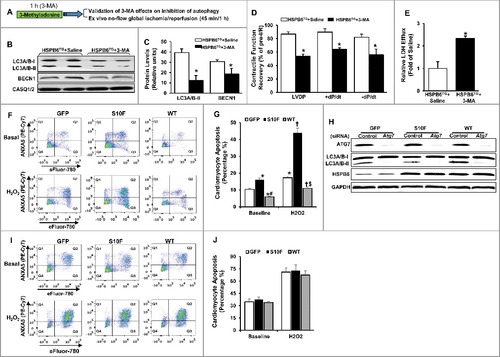
Figure 9. Preinhibition of autophagy dampens HSPB6-mediated cardioprotective effects. (A), A diagram of the experimental protocol; (B and C), The levels of LC3A/B-II and BECN1 were reduced in the HSPB6 WT hearts pretreated with 3-MA; (D), Post-I/R myocardial function recovery was significantly reduced in 3-MA-treated HSPB6 WT mice, compared with saline-treated HSPB6 WT mice; (E), Total LDH in coronary effluent, collected during the first 10 min of reperfusion, was significantly increased in HSPB6 WT mice treated with 3-MA, compared with saline group. n = 6 hearts for each group. Values represent means ± SEM; *: P < 0.05, vs saline group; (F to J), siRNA-mediated inhibition of autophagy abolishes the protective effects of HSPB6 WT: (F), Representative flow cytometric pseudo-color density plots illustrating the distribution of apoptosis in siRNA-control-treated neonatal rat cardiomyocytes infected with Ad-GFP, Ad-Hspb6S10F or Ad-Hspb6 WT under baseline or hypoxia (H2O2, 500 μM, 24 h) conditions. Cell apoptosis is featured by the exposure of phosphatidylserine at cell surface and dense clumping of genetic material in nucleus, which can be indicated by ANXA5-binding and eFluor-labeling, respectively. The early phase of apoptosis can be revealed by ANXA5 alone, whereas the late apoptosis appears when the cell is double positive for ANXA5 and eFluor. Q1: early apoptosis; Q2: late apoptosis; Q4: live cells; (G), Quantitative analysis of total apoptotic events in the absence (baseline) or presence of hypoxic injury; (H), Representative immunoblots of ATG7, LC3A/B-I/LC3A/B-II and HSPB6, using CASQ1/2 as loading control, in Ad-GFP, Ad-Hspb6S10F or Ad-Hspb6 WT cardiomyocytes transfected with siRNA-Control siRNA or Atg7 siRNA; (I), Representative flow cytometric pseudo-color density plots illustrating the distribution of apoptosis in infected cardiomyocytes after knockdown of Atg7; (J), Quantitative analysis of total apoptotic events after knockdown of Atg7 under basal and hypoxic conditions. Values are presented as means ± SEM, n = 6 preparations for each group. *: P < 0.05, vs GFP-baseline; #: P < 0.05, vs HSPBS10F-baseline; †: P < 0.05, vs GFP and H2O2; $: P < 0.05, vs HSPBS10F and H2O2.