Figures & data
Figure 1. CPTP depletion induces autophagy but not apoptosis. (A) Flow cytometry analyses of HeLa cells stained with ANXA5-APC and 7AAD-PE-Cy5 after transfection for 24 h using control vector (EGFPN1), EGFPN1-CPTP, or shCPTP. Representative raw data are shown in Fig. S1. (B) Western immunoblot analysis for PARP (116 kD), cleaved PARP (89 kD), proCASP3 (32 kD) and cleaved CASP3 (17 kD) at 24 h post transfection, confirming that CPTP expression changes do not induce apoptosis. (C) Cell death/viability at 48 h post transfection analyzed using trypan blue dye exclusion assay. (D) Fluorescence microscopy images of HeLa and HEK-293 cells cotransfected with GFP-LC3 plasmid with either scrambled-siCPTP (control) or siCPTP. Adjacent bar graphs show quantification of LC3-II puncta per cell based on analyses of 20 cells per group in 3 independent experiments carried out in triplicate. Values are means ± s.e.m. *P < 0.05, **P < 0.01, ***P < 0.001 Student t test compared to controls. (E) Western immunoblot analyses of HeLa and HEK-293 cells treated as in (D) but showing CPTP depletion along with SQSTM1 and processed LC3 levels. ACTB (loading control) serves as baseline for ratiometric comparisons of band intensities. (F) Fluorescence microscopy images of HEK-293 cells cotransfected with plasmid encoding mCherry-LC3 and either GFP-GLTP, shGLTP and GFP-vector or GFP-GLTPW96A. (G) Immunoblot analysis of HEK-293 cells cotransfected with plasmid encoding GFP-LC3 and either GFP-GLTP, shGLTP and GFP-vector or GFP-GLTPW96A. Bars: 10 µm.
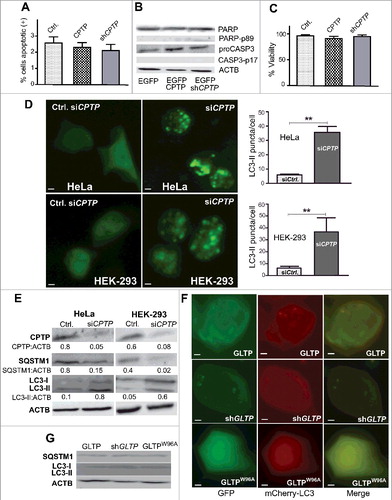
Figure 2. CPTP depletion induces autophagic flux. (A) BSC-1 and (B) HEK-293 cells were either transfected with dual-label pBABE-puro-mCherry-EGFP-LC3 plasmid containing either scrambled-shCPTP (control) or shCPTP. Quantification of autophagic puncta is depicted in adjacent graphs representing 3 independent experiments. (C) HEK-293 cells cotransfected with plasmid encoding GFP-LC3, RFP-LAMP1 and either scrambled-siCPTP (control) or siCPTP. Bottom row shows positive control for autophagy produced by starving cells for 2 h in EBSS medium before cotransfecting with a plasmid encoding GFP-LC3 and RFP-LAMP1. Bars: 10 µm. The merged imaging suggests colocalization of LC3 and LAMP1 with quantification shown in the adjacent panel. For quantification, 20 cells per group were analyzed in 3 independent experiments carried out in triplicate. Values are means ± s.e.m. *P < 0.05, **P < 0.01, ***P < 0.001 Student t test compared with controls.
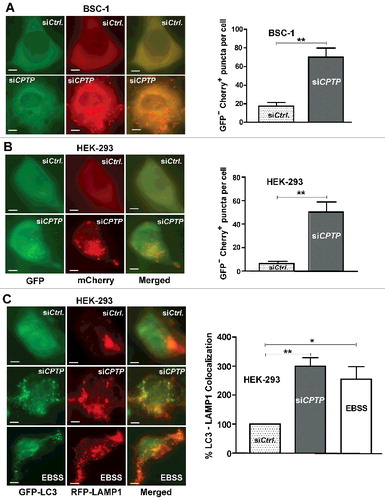
Figure 3. Ablation of C1P intermembrane transfer by CPTP mutation induces autophagy. (A) Fluorescence microscopy of HEK-293 cells cotransfected with plasmid encoding mCherry-LC3 and GFP-WT-CPTP, GFP-vector control, GFP-CPTPK60A or GFP-CPTPR106L. The adjacent panel provides quantification of LC3 puncta averaged for 20 cells per group. Bars: 10 µm. (B) Western immunoblot analysis of HEK-293 cells treated as in (A) and showing LC3-II:ACTB and SQSTM1:ACTB quantified ratios. (C) Fluorescence microscopy of HEK-293 cells cotransfected with GFP-WIPI and either scrambled siCPTP (control) or siCPTP. In the adjacent bar graph, WIPI1 puncta are quantified using 20 cells per group in 3 independent experiments. Values are means ± s.e.m of 3 independent experiments. *P < 0.05, **P < 0.01, ***P < 0.001 Student t test.
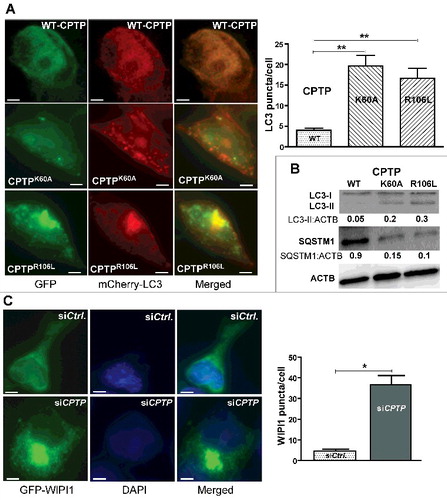
Figure 4. Golgi fragments induced by CPTP depletion partially localize with LC3. (A) HEK-293 cells grown in complete medium, were cotransfected with a plasmid encoding GFP-LC3 and mCherry-MAN2A1 (medial Golgi marker) and then treated with scrambled-siCPTP (control), siCPTP, or subjected to serum starvation (EBSS, 2 h). The green channel shows LC3-II puncta, the red channel shows the medial-Golgi stacks visualized with mCherry-MAN2A1, and the merged yellow channel shows colocalized LC3-II and Golgi fragments. In the adjacent bar graph, the colocalization percentage for LC3 and MAN2A1 in the siCPTP- or EBSS-treated cells is normalized to siCtrl-treated cells. Bars: 10 µm. (B) HEK-293 cells, treated with either scrambled-shCPTP and GFP-vector (shCtrl.) or shCPTP and GFP-vector, were immunolabeled with primary antibody (ab) to ATG9A followed by Alexa Fluor 595 secondary antibody. In CPTP-depleted cells, the red channel shows cytoplasmically dispersed ATG9A, which otherwise localizes mostly to the perinuclear space in shCtrl-treated cells. Quantification in the adjacent bar graph involved image analyses of 20 cells per group from 3 independent experiments. Values are means ± s.e.m of 3 independent experiments carried out in triplicate. *P < 0.05, **P < 0.01, ***P < 0.001 Student t test compared to controls.
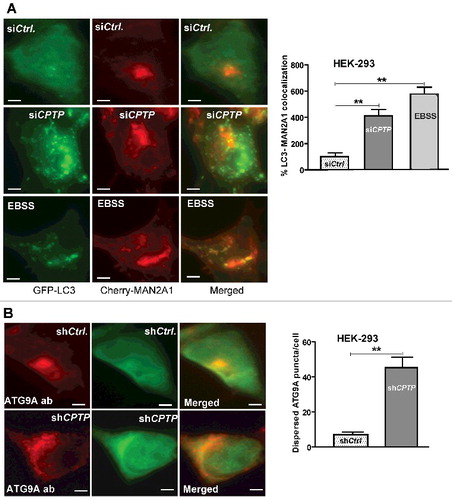
Figure 5. Autophagy induced by CPTP depletion is MTOR-dependent. (A) Western immunoblot analyses of CPTP, p-MTOR (phosphorylated Ser2448), MTOR, p-RPS6KB1 (phosphorylated Thr389), and RPS6KB1 levels in HeLa and HEK-293 cells transfected with siCPTP or scrambled-siCPTP (Ctrl) for 24 h. (B) Western immunoblot analyses of p-MTOR, MTOR, p-RPS6KB1, and RPS6KB1 levels in HEK-293 cells overexpressing GFP-CPTP for 24 h (right lane) versus mock controls (left lane) prior to starving the cells in EBSS media for 2 h. In (A) and (B), quantitative insights are provided by ratiometric comparisons of band intensities to ACTB (loading control).
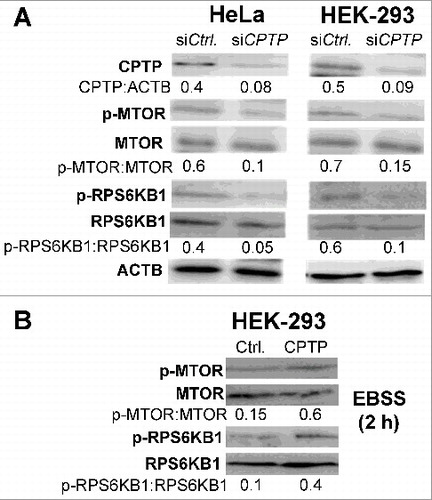
Figure 6. CPTP overexpression mitigates starvation-induced autophagy. (A) Autophagic puncta (mCherry-LC3) levels in HEK-293 cells transfected with plasmid encoding GFP-CPTP or mock GFP-vector control and grown in complete DMEM medium (Control) or starved by incubating for 2 or 6 h in nutrient-depleted EBSS medium. Bar graphs represent 20 cells per group in 3 independent experiments. Values are means ± s.e.m of 3 independent experiments carried out in triplicate. *P < 0.05, **P < 0.01, ***P < 0.001 2-way ANOVA. (B) Western immunoblot analysis of HEK-293 cells expressing either mock GFP-vector control or GFP-WT-CPTP for 24 h prior to subjecting to complete medium (controls) or nutrient-starvation for 6 h in EBSS medium. Quantitative insights are provided by ratiometric comparisons of band intensities to ACTB (loading control).
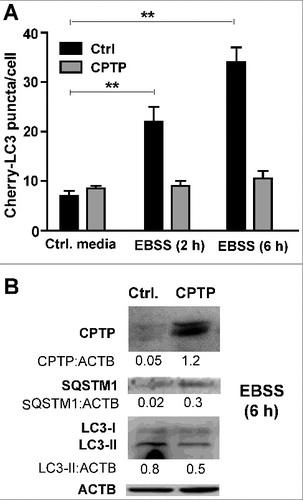
Figure 7. CPTP depletion or exogenous C1P treatment increases release of pro-inflammatory cytokines by inducing inflammasome activation. Human THP-1 cells were differentiated, primed, and treated as described in Materials and methods. (A) IL1B and (B) IL18 levels were detected using fluorescent antibody-based ELISA and flow cytometry. (C) Activated CASP1 levels were detected by labeling with FLICA 660-YVAD-FMK followed by flow cytometry. (D) Inflammasome assembly in differentiated, LPS-primed THP-1 cells treated with siCPTP, activated with alum, or overexpressing CPTP, assessed by western immunoblotting for supernatant (Sup) levels of CASP1-p20, IL1B-p17, and cleaved IL18 and cell lysate (Lys) levels of proCASP1, proIL1B, proIL18 and LC3. In the surrounding bar graphs, quantification is provided by ratiometric comparisons of CASP1-p20, IL1B-p17, and cleaved IL18 levels to ACTB (loading control). (E) and (F) IL1B release from THP-1 cells (E) or A549 lung epithelial cells (F) treated with exogenous C1P or PA (1 μM) as described in the Methods and/or transfected with siCPTP or siCtrl. THP-1 cells were differentiated with PMA and primed with LPS prior to treatments. *P < 0.05, **P < 0.01, ***P < 0.001 Student t test.
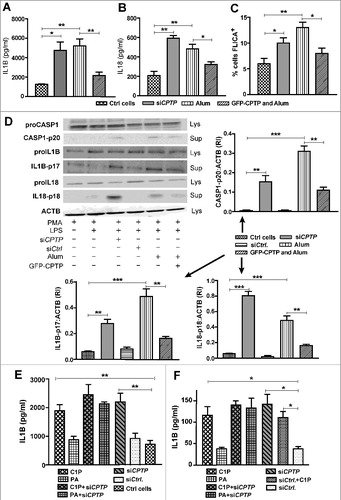
Figure 8. Inflammasome assembly is induced by CPTP depletion. THP-1 cells (differentiated and primed) subjected to (A) shNLRP3, (B) shPYCARD, or shNLRC4 and then analyzed by western blot following treatment with scrambled-siCPTP (control), siCPTP, or alum. ELISA measurements (C-F) showing IL1B levels (C-D) and IL18 levels (E-F) in THP-1 cells treated as in (A) and (B). Values are means ± s.e.m of 3 independent experiments carried out in triplicate. *P < 0.05, **P < 0.01, ***P < 0.001 2-way ANOVA compared to THP-1 control cells (PMA-differentiated and LPS-primed); qPCR analyses of NLRP3, PYCARD, NLRC4 and CASP1 expression (Fig. S9) indicated 6- to 8-fold reduction of mRNA target gene expression by shNLRP3, shPYCARD, shNLRC4 and shCASP1.
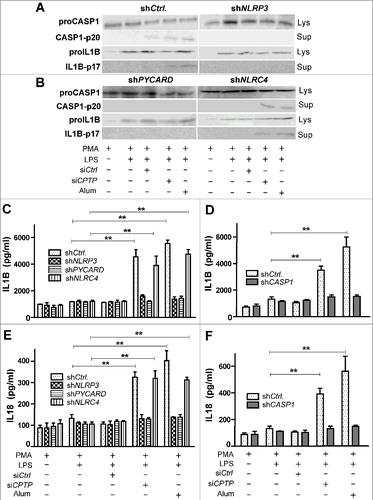
Figure 9. CPTP depletion or exogenous C1P treatment induces autophagy in THP1 and A549 cells. (A) Fluorescence microscopy showing LC3 puncta in THP-1 cells (differentiated and primed) expressing GFP-LC3. Sample lysates activated with alum (300 mg/ml for 3 h) or cotransfected with siCPTP show significantly increased LC3-II puncta compared to cells transfected with scrambled-siCPTP (control). GFP-WT-CPTP overexpression mitigates the alum-induced autophagy in THP-1 cells. Bars: 10 µm. For quantification (adjacent bar graphs), 15 cells were analyzed per group in 3 independent experiments. Values are means ± s.e.m of 3 independent experiments. (B) Western immunoblot analyses of LC3-II levels in THP-1 cells (differentiated and primed) treated with siCPTP, activated with alum, or overexpressing CPTP. Levels of LC3-II quantified relative to ACTB (loading control) are shown in the adjacent bar graph. *P < 0.05, **P < 0.01, ***P < 0.001 Student t test. (C) and (D) Western immunoblot analyses of LC3-II levels in THP-1 cells (C) or A549 cells (D) treated with exogenous C1P or PA (1 μM) as described in Materials and methods and transfected with siCPTP or siCtrl. THP-1 cells were PMA-differentiated and LPS-primed prior to treatments.
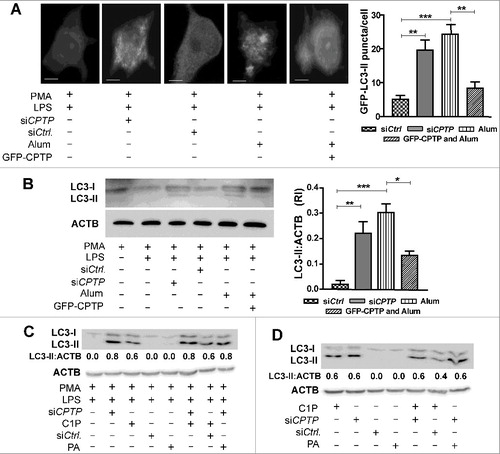
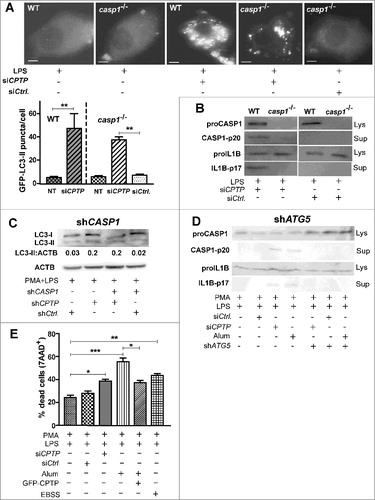
Figure 10. Autophagy induced by CPTP depletion is CASP1 independent, but inflammasome-driven IL1B processing that leads to pyroptotic cell death is autophagy dependent. (A) Fluorescence microscopy showing LC3 puncta in murine macrophages (WT, wild type; CASP1−/−, casp1 knockout cells) primed with LPS and cotransfected with plasmid encoding GFP-LC3, siCPTP or scrambled siControl. Bars: 10 µm). For quantification (bar graph below micrograph), 15 cells were analyzed per group in 3 independent experiments. Values are means + s.e.m of 3 independent experiments. (B) Western immunoblot showing levels of proCASP1, CASP1-p20, proIL1B and IL1B-p17 in murine macrophages (WT or CASP1−/−). Cells were LPS primed and transfected with either siCPTP or non-targeting siCtrl. (C) Western immunoblot analysis of LC3-II in THP-1 cells (differentiated and primed) treated with shCASP1, shCPTP or scrambled shCtrl. ACTB (loading control) provides baseline for ratiometric comparisons of band intensities. (D) Western immunoblot analyses of CASP1-p20, and IL1B-p17 levels in cell supernatants and proCASP1 and proIL1B in cell lysates in THP-1 cells cotransfected with shATG5 and either siCPTP or scrambled siCtrl vectors. (E) Flow cytometry analyses of THP-1 cells stained with 7AAD-PE-Cy5 (670/14 nm bandpass) to detect permeabilized nuclei (DNA labeling) after indicated treatments without transfections or at 24 h post-transfection. All comparisons are relative to controls for each treatment condition, *P < 0.05, **P < 0.01, ***P < 0.001 Student t test.