Figures & data
Figure 1. ALP inhibition enhances SNCA release. (A, B) ICC showing increased expression and homogeneous SNCA distribution in SNCA-overexpressing H4 cells (SNCA H4 compared to CTR H4) and neurons (SNCA-tg compared to WT). TUBB3 or GFP were used to visualize cellular outline. Scale bar: 10 µm. SNCA expression was also examined by WB analysis of cell lysate from H4 cells (C) or neurons (D). SNCA is not detectable in CTR H4, therefore quantification was not applicable. SNCA-tg neurons overexpress the protein by 2.5 fold compared to WT (*p = 0.024, N = 3). ACTB or TUBB3 were used as loading controls. (E) Dot blot analysis of SNCA H4 conditioned medium (CM) shows that relative total extracellular SNCA levels increase by treatment with the ALP inhibitors Baf and CQ over the corresponding Veh, which is plotted as a dotted line. (For Baf: *p<0.05, with 2 nM N = 7, 10 nM N = 6, 20 and 200 nM N = 5, one sample t test; for 50 µM CQ: **p<0.008, N = 4, one sample t test.) (F) Total extracellular SNCA was assessed by ultra-sensitive ELISA, and values were normalized to total cell protein of the corresponding lysate. With 20 nM Baf or 50 µM CQ, an approximately 3-fold SNCA increase over Veh was measured (for Baf: **p = 0.002, N = 3; for CQ: *p = 0.013, N = 4). (G) The ratio of extracellular:intracellular SNCA was calculated from the ELISA measurements. Baf (20 nM) and CQ (50 µM) increased by approximately 4 fold the percent SNCA amount present extracellularly over intracellularly. (For Baf: ***p = 0.0003, N = 3; for CQ: ** p = 0.007, N = 4.)
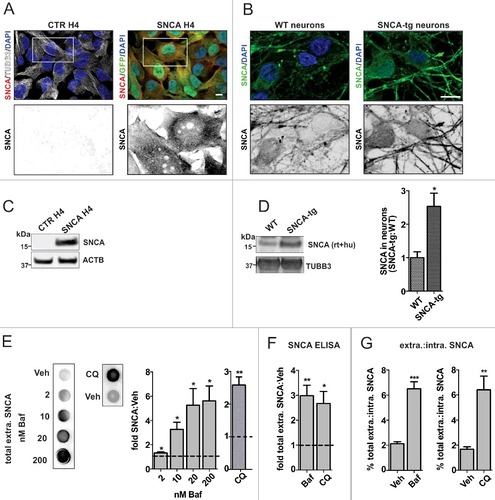
Figure 2. SNCA release via EVs. (A) SNCA H4 cells were treated with Veh or 20 nM Baf, and EVs were isolated by ultracentrifugation. We observed SNCA-6-nm gold particle-positive EVs (examples are indicated by white arrows). Eight immuno-EM micrographs of approximately 0.3 µm2 area were analyzed, and Baf was found to increase SNCA-gold-positive EVs by 5 fold (****p<0.0001, N = 130 EVs). Scale bar: 50 nm. (B) EVs were treated with Na2CO3 and the soluble (sol.) and membrane (memb.) fractions were analyzed on the same WB. SNCA was detected in both fractions and increased by Baf (low “l” and higher “h” signal exposures are shown). (C) EVs were isolated from identical volumes of a single CM preparation, by either ultracentrifugation (ucf) or immuno-isolation (magnetic beads coupled to human tetraspanins CD9, CD63, CD81). Equal volumes were analyzed on the same WB and SNCA was identified in both EV preparations. EVs were positive for the MVB-EV marker FLOT1. The specific FLOT1 band is indicated by the arrow, because in immuno-isolated EVs an additional band was observed (indicated by the asterisk) at approximately 53 kDa. This band probably represents the immunoglobulin signal from the antibodies attached to the immuno-isolation beads. (D) Graphs show SNCA and FLOT1 immuno-reactivity normalized to the mean values measured in CD9-CD63-CD81+ EVs (and therefore represents “relative” levels). Baf led to approximately 4-fold higher SNCA levels (F[3,16] = 16.46, ****p<0.0001 with N = 5, one way ANOVA, where the F ratio is reported as degrees of freedom [between columns] and residual [random] degrees of freedom) and 1.5-fold higher FLOT1 levels (F[3,16] = 7.382, **p = 0.0025 with N = 5, one way ANOVA). (E) SNCA H4 cells were treated with Veh or 20 nM Baf and a volume of 2 mL SNCA H4 CM (containing EVs) was mixed with 2 mL EV-depleted CM from the identical preparation (containing “free” SNCA but no EVs). As control (ctr), the 2 mL of SNCA H4 CM were mixed with 2 mL unconditioned medium (containing no SNCA and no EVs). After incubation at 37 °C for 24 h, EVs were immuno-isolated and analyzed by WB. Graphs show fold SNCA and FLOT1 immuno-reactivity normalized to the mean values of Veh condition. SNCA within EVs was not altered by the addition of free SNCA (F[3,18] = 6.038, p = 0.005 with N = 7 for Veh and N = 4 for Baf, and Tukey´s post-hoc indicated a statistically significant difference for Veh vs. Baf but not for ctr vs. free SNCA comparisons). (F) After treatment with 20 nM Baf or 300 nM Rote, EVs were immuno-isolated and analyzed by WB. Baf led to a robust increase in SNCA levels, whereas Rote had only a moderate influence (F[2,9] = 38.37, p<0.0001 with N = 4, and Tukey´s post-hoc indicated a statistically significant difference for the Veh vs. Baf and Baf vs. Rote comparisons). FLOT1 appeared upregulated by Baf but not Rote (F[2,9] = 2.541, p>0.05 with N = 4).
![Figure 2. SNCA release via EVs. (A) SNCA H4 cells were treated with Veh or 20 nM Baf, and EVs were isolated by ultracentrifugation. We observed SNCA-6-nm gold particle-positive EVs (examples are indicated by white arrows). Eight immuno-EM micrographs of approximately 0.3 µm2 area were analyzed, and Baf was found to increase SNCA-gold-positive EVs by 5 fold (****p<0.0001, N = 130 EVs). Scale bar: 50 nm. (B) EVs were treated with Na2CO3 and the soluble (sol.) and membrane (memb.) fractions were analyzed on the same WB. SNCA was detected in both fractions and increased by Baf (low “l” and higher “h” signal exposures are shown). (C) EVs were isolated from identical volumes of a single CM preparation, by either ultracentrifugation (ucf) or immuno-isolation (magnetic beads coupled to human tetraspanins CD9, CD63, CD81). Equal volumes were analyzed on the same WB and SNCA was identified in both EV preparations. EVs were positive for the MVB-EV marker FLOT1. The specific FLOT1 band is indicated by the arrow, because in immuno-isolated EVs an additional band was observed (indicated by the asterisk) at approximately 53 kDa. This band probably represents the immunoglobulin signal from the antibodies attached to the immuno-isolation beads. (D) Graphs show SNCA and FLOT1 immuno-reactivity normalized to the mean values measured in CD9-CD63-CD81+ EVs (and therefore represents “relative” levels). Baf led to approximately 4-fold higher SNCA levels (F[3,16] = 16.46, ****p<0.0001 with N = 5, one way ANOVA, where the F ratio is reported as degrees of freedom [between columns] and residual [random] degrees of freedom) and 1.5-fold higher FLOT1 levels (F[3,16] = 7.382, **p = 0.0025 with N = 5, one way ANOVA). (E) SNCA H4 cells were treated with Veh or 20 nM Baf and a volume of 2 mL SNCA H4 CM (containing EVs) was mixed with 2 mL EV-depleted CM from the identical preparation (containing “free” SNCA but no EVs). As control (ctr), the 2 mL of SNCA H4 CM were mixed with 2 mL unconditioned medium (containing no SNCA and no EVs). After incubation at 37 °C for 24 h, EVs were immuno-isolated and analyzed by WB. Graphs show fold SNCA and FLOT1 immuno-reactivity normalized to the mean values of Veh condition. SNCA within EVs was not altered by the addition of free SNCA (F[3,18] = 6.038, p = 0.005 with N = 7 for Veh and N = 4 for Baf, and Tukey´s post-hoc indicated a statistically significant difference for Veh vs. Baf but not for ctr vs. free SNCA comparisons). (F) After treatment with 20 nM Baf or 300 nM Rote, EVs were immuno-isolated and analyzed by WB. Baf led to a robust increase in SNCA levels, whereas Rote had only a moderate influence (F[2,9] = 38.37, p<0.0001 with N = 4, and Tukey´s post-hoc indicated a statistically significant difference for the Veh vs. Baf and Baf vs. Rote comparisons). FLOT1 appeared upregulated by Baf but not Rote (F[2,9] = 2.541, p>0.05 with N = 4).](/cms/asset/f1fd9dff-db02-49d9-a7f5-0a4787a222a3/kaup_a_1395992_f0002_b.gif)
Figure 3. ALP inhibition particularly stimulates SNCA release in EVs. SNCA H4 cells were treated with the indicated compounds and EVs were isolated by ultracentrifugation. (A) WB analysis of equal EV volumes shows increased SNCA levels under 2–200 nM Baf treatment (F[4,25] = 5.903, **p = 0.002 with N ≥5, one way ANOVA). (B) ACHE assessment of equal EV volumes was performed to estimate EV abundance across different Baf concentration conditions. Baf did not lead to statistically significant changes (F[4,19] = 1.811, p>0.05 with N ≥5, one way ANOVA). (C) WB analysis confirming SNCA H4 EV fraction purity. EVs are positive for MVB-EV markers (FLOT1, RAB11 and CD81), but negative for ER (CALR) or mitochondria (Mito) marker (HSPD1/HSP60). All markers were identified in corresponding lysates (“cells”), which were analyzed on the same gel and shown for an identical exposure time (boxed). (D) SNCA was assessed by ELISA in sonicated EVs and values were normalized to total cell protein of the corresponding lysate. Baf (20 nM) and CQ (50 µM) increased SNCA levels by approximately 4 fold over Veh (dotted line) (for Baf: ***p = 0.0003, N = 3; and for CQ: *p = 0.035, N = 3). (E) The fold SNCA increase (by ELISA) in the total extracellular versus the EV fraction was statistically compared for 20 nM Baf or CQ. The increase was more prominent in the EV fraction (for Baf: *p = 0.032, N = 3; for CQ p>0.05, N = 3). (F) WB analysis of SNCA in equal EV volumes from neuronal cells. Application of 20 nM Baf increases SNCA over Veh (dotted line) in both WT and SNCA-tg neuronal culture EVs (*p = 0.023, N = 3). (G) SNCA immuno-gold labeling (lower panel) shows 10-nm gold particles, representing SNCA, in association with CSF EVs. Scale bar: 75 nm. (H) CSF EV fractions from control subjects and DLB patients are positive for SNCA and MVB-EV markers (PDCD6IP, CD81 and CD63).
![Figure 3. ALP inhibition particularly stimulates SNCA release in EVs. SNCA H4 cells were treated with the indicated compounds and EVs were isolated by ultracentrifugation. (A) WB analysis of equal EV volumes shows increased SNCA levels under 2–200 nM Baf treatment (F[4,25] = 5.903, **p = 0.002 with N ≥5, one way ANOVA). (B) ACHE assessment of equal EV volumes was performed to estimate EV abundance across different Baf concentration conditions. Baf did not lead to statistically significant changes (F[4,19] = 1.811, p>0.05 with N ≥5, one way ANOVA). (C) WB analysis confirming SNCA H4 EV fraction purity. EVs are positive for MVB-EV markers (FLOT1, RAB11 and CD81), but negative for ER (CALR) or mitochondria (Mito) marker (HSPD1/HSP60). All markers were identified in corresponding lysates (“cells”), which were analyzed on the same gel and shown for an identical exposure time (boxed). (D) SNCA was assessed by ELISA in sonicated EVs and values were normalized to total cell protein of the corresponding lysate. Baf (20 nM) and CQ (50 µM) increased SNCA levels by approximately 4 fold over Veh (dotted line) (for Baf: ***p = 0.0003, N = 3; and for CQ: *p = 0.035, N = 3). (E) The fold SNCA increase (by ELISA) in the total extracellular versus the EV fraction was statistically compared for 20 nM Baf or CQ. The increase was more prominent in the EV fraction (for Baf: *p = 0.032, N = 3; for CQ p>0.05, N = 3). (F) WB analysis of SNCA in equal EV volumes from neuronal cells. Application of 20 nM Baf increases SNCA over Veh (dotted line) in both WT and SNCA-tg neuronal culture EVs (*p = 0.023, N = 3). (G) SNCA immuno-gold labeling (lower panel) shows 10-nm gold particles, representing SNCA, in association with CSF EVs. Scale bar: 75 nm. (H) CSF EV fractions from control subjects and DLB patients are positive for SNCA and MVB-EV markers (PDCD6IP, CD81 and CD63).](/cms/asset/3bbc9dba-fdeb-47f8-b440-4e66c88b5f68/kaup_a_1395992_f0003_b.gif)
Figure 4. Fused MVB-autophagosome compartment under ALP inhibition. H4 cells were treated with Veh or 20 nM Baf. (A) White arrows indicate an autophagosome (AP) (left) and a MVB (right), which are clearly distinguished under basal conditions (Veh). For an impression of the whole cytoplasm see Fig. S6A. Bar: 500 nm. (B) Baf leads to a widespread, fused AP-MVB compartment throughout the cytoplasm (also see Fig. S6A). The individual vesicles show characteristics of both APs and MVBs, because both cytoplasm and smaller vesicles resembling MVB intralumenal vesicles are present. Additionally, these structures are fused to one another. The enlarged frame on the right shows an example. Bar: 500 nm. (C) The size of the different intracellular structures is depicted. Under Veh, 11 autophagosomes (4 individual cells) and 2 MVBs were measured (2 individual cells, their definition was only possible at high magnification). Under Baf, 58 fused AP-MVB structures were measured (5 individual cells). (D) ICC analysis of the autophagy receptor protein SQSTM1, which accumulated in a punctate pattern under Baf. The number of SQSTM1 puncta per cell, analyzed by ImageJ, was increased (****p<0.0001, Veh N = 58 and Baf N = 55 individual cells were measured). Bar: 10 µm. (E) ALP flux was also analyzed by WB, for levels of SQSTM1 and autophagosome membrane marker LC3-II. The level of these markers was increased (*p = 0.026, N = 6), indicating that 20 nM Baf inhibited ALP flux.
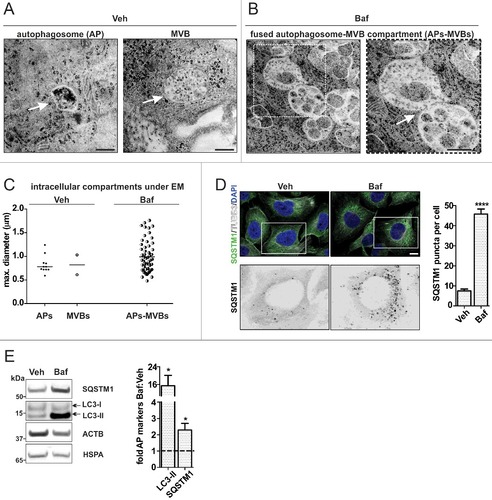
Figure 5. Increased autophagosome features in H4 EVs under ALP inhibition. SNCA H4 cells were treated with 2 or 20 nM Baf. (A) The lysate (cells) and corresponding EVs (equal volumes) were analyzed on the same WB. Note that in EVs, the ALP markers LC3-II and SQSTM1 are clearly identified under 20 nM Baf treatment. EV purity was confirmed by the presence of FLOT1 and the absence of CALR. The EV protein composition was further addressed after 20 nM Baf, 50 µM CQ or 200 ng/mL Rapa, in CTR H4 and SNCA H4 cells. (B) Equal EV volumes from both cell populations were analyzed on the same blot. The ALP markers LC3-II and SQSTM1 appeared exclusively under Baf and CQ, but not Rapa. The ALP-related marker GAPDH was present in all fractions. EV purity was confirmed by the presence of FLOT1 and PDCD6IP. (C-D) GAPDH levels in EVs were upregulated by Baf, without reaching statistical significance (p>0.05, N = 3 by one sample t test). FLOT1 levels in EVs were also upregulated over Veh (dotted line) by Baf and CQ, but not Rapa, in both cell populations (for CTR H4 Baf: *p = 0.047, N = 8; for SNCA H4 Baf **p = 0.003, N = 9 by one sample t test; for CQ: p>0.05, N = 4 by one sample t test; for Rapa: p>0.05, N = 3 by one sample t test).
Table 1. Selected set of proteins identified by mass spectrometry in H4 EVs
Figure 6. Increased autophagosome features in neuronal EVs under ALP inhibition. (A, C) ICC analysis of the neuronal marker MAP2 in WT and SNCA-tg neuronal cultures. (B, D) After application of 20 nM Baf, the lysate (cells) and corresponding EVs (equal volumes) were analyzed on the same WB. Note that in EVs, the ALP markers LC3-II and SQSTM1 are identified in both the Veh and 20 nM Baf condition. The quantification shows that these proteins are increased by Baf:Veh (dotted line) (*p = 0.038, N = 3, one sample t test). Levels of FLOT1 were not significantly altered (p>0.05, N = 3, one sample t test). The accumulation of LC3-II and SQSTM1 in the corresponding lysate confirmed ALP inhibition in both cell populations.
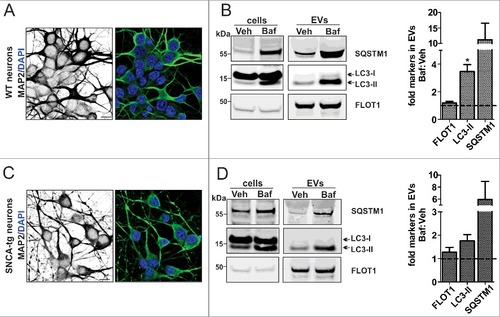
Table 2. Demographics and comorbidities
Figure 7. Human CSF contains LC3-II- and SQSTM1-positive EVs. (A) EV isolation workflow. Total CSF was either centrifuged at 10,000 × g or filtered through 0.2-µm filter, followed by ultracentrifugation. All biochemical assays were performed after 1 or 2 cycles of freeze/thawing of the CSF-derived EVs. (B) WB analysis of EVs and total CSF from PD patients (, subjects 9–12). LC3-II and SQSTM1 was identified in the CSF-derived EVs isolated from 2.5 – 4 mL. FLOT1 indicates EV enrichment. EVs from 20 nM Baf-treated cells (H4 EVs) were used as a reference. A blot only probed with mouse IgG secondary antibody was simultaneously developed as control for FLOT1 specificity. Nonspecific bands are marked with an asterisk and specific bands are shown by the arrow (the original blot for 2 different exposures can be seen in Fig. S9). (C) WB analysis of CSF-derived EVs from 2 control subjects (, subjects 7, 8). EV samples collected from an initial volume of (i) 1.4 mL or (ii) 2.5 mL of total CSF were analyzed.
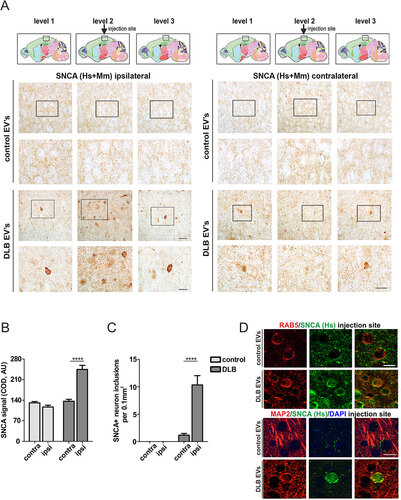
Figure 8. CSF EVs are involved in the cell-to-cell transfer of SNCA in vivo. (A) IHC of SNCA (human and rodent, Hs+Mm) in the neuropil ipsilateral and contralateral to the EVs injection site (level 2, black box), 4 wk post injection. Intervals of 250-µm thickness from the injection site (levels 1 to 3) are shown. Anatomical reference images were modified from Allen Mouse Brain Atlas (Sagittal Atlas images 12, 13 and 14, http://mouse.brain-map.org/static/atlas).Citation93 Scale bar: 30 µm; corresponding insert: 15 µm. (B) SNCA corrected optical density (COD) at the injection site was plotted using the contralateral values as a reference for signal background and (C) graph depicts the number of neurons with SNCA inclusions per area. Two-way ANOVA indicated a significant interaction of treatment (control vs. DLB CSF EVs) with p<0.0001 and Bonferroni post-hoc indicated a significant difference ****p<0.0001 of contra vs ipsilateral side for DLB CSF EVs but not control CSF EVs). N = 6 mice were injected with control and N = 6 with DLB CSF EVs. (D) IHC of SNCA (human-specific antibody) at the injection site. Human SNCA partly colocalized with the endosomal marker RAB5 and the neuronal marker MAP2. Scale bar: 15 µm.