Figures & data
Figure 1. csnk2b∆/∆, HSA-Cre muscle fibers exhibit impairment of neural transmission and morphological abnormalities. (A) The table summarizes electrophysiological recordings of intracellular miniature endplate current (mEPC) amplitude, rise, and decay time constants at NMJs of control and csnk2b∆/∆, HSA-Cre mice. A statistically significant difference was only found for mEPC amplitude of strongly fragmented, in comparison with less fragmented, NMJs of csnk2b∆/∆, HSA-Cre mice. No difference was detected between less fragmented NMJs of the csnk2b∆/∆, HSA-Cre in comparison with NMJs of control mice. Extracellular recordings of compound muscle action potential (CMAP) and CMAP decrement (5Hz) did not reveal any changes between control and csnk2b∆/∆, HSA-Cre diaphragm muscles. Three mice per genotype were recorded. N = number of NMJs. (B) Representative images of hematoxylin and eosin or COX stained hind limb muscle cross sections are shown. Note, dark colored mitochondrial rich fibers (type I and IIa) are less colored in the adult 6- to 8-month-old csnk2b∆/∆, HSA-Cre muscles. Moreover, the histological stainings of cross-sections of the csnk2b∆/∆, HSA-Cre are of more granular appearance in comparison with controls. (C) Number of central nuclei were counted in control or csnk2b∆/∆, HSA-Cre gastrocnemius muscle cross-sections of adult 6- to 8-mo-old mice and presented as graph. N = 5 mice per genotype. (D) Quantification of the total number of TUNEL-positive nuclei of muscle fibers of 6- to 8-mo-old mice of control or csnk2b∆/∆, HSA-Cre muscles soleus and gastrocnemius per muscle cross-section. N = 5 mice per genotype. (E) Voluntary walking distance of control and csnk2b∆/∆, HSA-Cre mice is shown in relation to the age of the mice. N = 5 mice per genotype. Note, differences of walking distances between control and csnk2b∆/∆, HSA-Cre mice are not significant (P values >0.05).
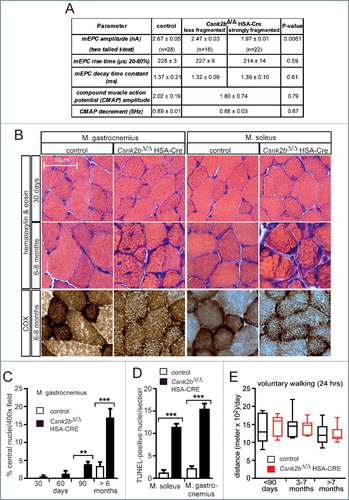
Figure 2. csnk2b∆/∆, HSA-Cre muscles possess fewer and functionally abnormal mitochondria. (A) The relative mitochondrial genome copy numbers of adult 6- to 8-mo-old mice of control and csnk2b∆/∆, HSA-Cre muscles were determined by qPCR. Values were normalized to PECAM1 and are presented as relative amount of control mitochondrial genome copy number (control is set to 1.0). N = 3 mice per genotype. (B) A Mito-EGFP allele was introduced into csnk2b∆/∆, HSA-Cre mice. Fluorescence intensities of Mito-EGFP of control and csnk2b∆/∆, HSA-Cre diaphragm muscles from 4- to 6-mo-old mice were detected by 2-photon microscopy and related to the sum of second-harmonic generation and Mito-EGFP signal intensities. This sum correlates with muscle fiber volume. Note, less EGFP fluorescence signal was detected in csnk2b∆/∆, HSA-Cre muscles in comparison with controls which points to a lower mitochondrial amount. N = 3 mice per genotype. (C) Representative immunoblot images of mitochondrial proteins (TOMM20, a subunit of the mitochondrial outer membrane translocase; VDAC1/2 and VDAC3 (voltage dependent anion channel 1/2/3); SLC25A members 4/5/31 (solute carrier family 25 members 4/5/31); SDHA (succinate dehydrogenase complex flavoprotein subunit A); MDH2 (malate dehydrogenase 2) prepared from control and csnk2b∆/∆, HSA-Cre soleus and tibialis anterior muscles of adult 6 to 8-mo-old mice. Histone H3 was used as a control representing a protein, which belongs to a different organelle than mitochondria. ACTN2 was probed as loading control. (D) Protein bands shown in (C) were quantified using ImageJ, normalized to ACTN2, and their expression was plotted relative to control (set to 1.0). N = 5 mice per genotype. Note, there is a significant reduction of mitochondrial proteins in csnk2b∆/∆, HSA-Cre muscles. (E) The total number of TUNEL-positive cultured myotubes was determined after incubation of the cells with increasing amounts of hydrogen peroxide. Graph shows a comparison between wild-type and csnk2b∆/∆, HSA-Cre TUNEL-positive cells. (F) Mitochondrial membrane potential was measured in isolated fibers from old flexor digitorum brevis muscles of adult 6 to 8-mo-old mice of control and csnk2b∆/∆, HSA-Cre mice. Fibers were isolated, placed in cell culture, and loaded with TMRM. TMRM accumulates in the mitochondria that are able to maintain mitochondrial membrane potential. Oligomycin and the protonophore FCCP were added at the indicated time points. TMRM staining was monitored in at least 10 fibers per genotype. N = 3 mice per genotype. Note, mitochondria from csnk2b∆/∆, HSA-Cre mice were not able to hold inner mitochondrial membrane potential, like control mitochondria. (G) Isolated mitochondria from control and csnk2b∆/∆, HSA-Cre muscles were used to measure oxygen consumption after incubation with the indicated substrates and inhibitors, and calculate respiratory control rates which are summarized by the graph. N = 6 mice per genotype. Note, mitochondria of csnk2b∆/∆, HSA-Cre mice show lower respiratory control rates in comparison with mitochondria isolated from control muscles.
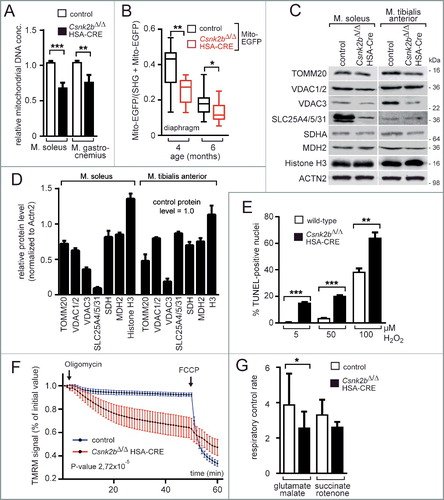
Figure 3. CSNK2 phosphorylates TOMM22 and the absence of Csnk2b compromises CSNK2 catalytical activity and protein amount, but neither is required for TOMM complex biogenesis nor mitochondrial protein import. (A) Mouse TOMM22 was purified and used for in vitro radio-isotope-assisted phosphorylation with different kinases. The image of the autoradiogram shows that mouse TOMM22 was only phosphorylated in the presence of protein kinase CSNK2 and is not phosphorylated by any of the other kinases used. The amount of histidine-tagged TOMM22 served as loading control. (B) In vitro radio-isotope-assisted phosphorylation of TOMM22 is less efficient by muscle lysates of csnk2b∆/∆, HSA-Cre mice in comparison with muscles of control litters. The amount of recombinant TOMM22 was adjusted by measuring the total protein amount and verified by Coomassie-stained SDS-PAGE. (C) Alignment of mouse and yeast TOMM22/Tom22 primary structure stretches. Potential mouse TOMM22 phosphosites in comparison with phosphosites in yeast Tom22 are depicted by asterisks. The panel also depicts kinase prediction scores for mouse phosphosites serine 15, threonine 43 and serine 45, obtained as potential CSNK2 target sites with ScanSite 3, Disphos 1.3, NetPhosK 1.0 and NetPhos 2. The target sequence of CSNK2 is known to be represented by [S-X-X-(D/E/pS/pY)].Citation39 (D) In vitro phosphorylation experiments were performed with purified mouse TOMM22 wild-type protein and its alanine mutants together with recombinant CSNK2 using radiolabeled ATP. (E) T7 tagged TOMM22 wild-type and alanine-mutant expression plasmids were transfected into cultured cells, protein lysates immunprecipitated by a T7-specific antibody, precipitates were resolved by SDS-PAGE, and western blot membranes incubated with either a T7 or a TOMM22-p-S15-specific antibody. Note, the TOMM22-p-S15-specific antibody detects wild-type TOMM22, but not the TOMM22S15A or TOMM22S15A,T43A mutants. (F) The amount of catalytic activity-containing CSNK2A1 and CSNK2A2 subunits was determined in the absence of Csnk2b in skeletal muscle fiber lysates. Skeletal muscles soleus and tibialis anterior were used from approximately 2- (n = 3 mice per genotype) and 6- to 8-mo-old (n = 3 mice per genotype) mice. Obviously, CSNK2B protein is absent in csnk2b∆/∆, HSA-Cre muscle lysates. ACTN2 served as loading control. (G and H) Graphs represent protein amounts of CSNK2 subunits which were analyzed before by western blot (F). Note, in response to the absence of Csnk2b, protein amounts of CSNK2A1 and CSNK2A2 subunits are delicately balanced and seem to be adjusted in a muscle-type specific manner. (I) To determine the capacity of mitochondria for importing precursor proteins the in organello import assay with radiolabeled precursor proteins was used.Citation72 [35S]-radiolabeled yeast proteins Cox4, Mdh1 and Atp2 were individually imported into mitochondria (Δψ, membrane potential). Mitochondria were treated with proteinase K and analyzed by SDS-PAGE. p, precursor; m, mature. Import into mitochondria after the longest import time was set to 100% (control). Note, all mitochondrial precursor (p) proteins are imported into mitochondria and processed to shorter mature (m) size with similar time kinetic between control and the csnk2b∆/∆, HSA-Cre indicating mitochondrial protein import in vitro being unaffected. (J) Mitochondria were isolated from skeletal muscles of adult wild-type or csnk2b∆/∆, HSA-Cre mice and equal amounts of native TOMM complexes were resolved by blue-native gels (BN) which are used to separate native protein complexes. After western blot, different TOMM family members within native TOMM complexes were detected by specific antibodies as shown by representative images. The amount of these TOMM family members is similar between TOMM complexes from mitochondria of wild-type or csnk2b∆/∆, HSA-Cre muscles, indicating proper biogenesis of TOMM complexes.
![Figure 3. CSNK2 phosphorylates TOMM22 and the absence of Csnk2b compromises CSNK2 catalytical activity and protein amount, but neither is required for TOMM complex biogenesis nor mitochondrial protein import. (A) Mouse TOMM22 was purified and used for in vitro radio-isotope-assisted phosphorylation with different kinases. The image of the autoradiogram shows that mouse TOMM22 was only phosphorylated in the presence of protein kinase CSNK2 and is not phosphorylated by any of the other kinases used. The amount of histidine-tagged TOMM22 served as loading control. (B) In vitro radio-isotope-assisted phosphorylation of TOMM22 is less efficient by muscle lysates of csnk2b∆/∆, HSA-Cre mice in comparison with muscles of control litters. The amount of recombinant TOMM22 was adjusted by measuring the total protein amount and verified by Coomassie-stained SDS-PAGE. (C) Alignment of mouse and yeast TOMM22/Tom22 primary structure stretches. Potential mouse TOMM22 phosphosites in comparison with phosphosites in yeast Tom22 are depicted by asterisks. The panel also depicts kinase prediction scores for mouse phosphosites serine 15, threonine 43 and serine 45, obtained as potential CSNK2 target sites with ScanSite 3, Disphos 1.3, NetPhosK 1.0 and NetPhos 2. The target sequence of CSNK2 is known to be represented by [S-X-X-(D/E/pS/pY)].Citation39 (D) In vitro phosphorylation experiments were performed with purified mouse TOMM22 wild-type protein and its alanine mutants together with recombinant CSNK2 using radiolabeled ATP. (E) T7 tagged TOMM22 wild-type and alanine-mutant expression plasmids were transfected into cultured cells, protein lysates immunprecipitated by a T7-specific antibody, precipitates were resolved by SDS-PAGE, and western blot membranes incubated with either a T7 or a TOMM22-p-S15-specific antibody. Note, the TOMM22-p-S15-specific antibody detects wild-type TOMM22, but not the TOMM22S15A or TOMM22S15A,T43A mutants. (F) The amount of catalytic activity-containing CSNK2A1 and CSNK2A2 subunits was determined in the absence of Csnk2b in skeletal muscle fiber lysates. Skeletal muscles soleus and tibialis anterior were used from approximately 2- (n = 3 mice per genotype) and 6- to 8-mo-old (n = 3 mice per genotype) mice. Obviously, CSNK2B protein is absent in csnk2b∆/∆, HSA-Cre muscle lysates. ACTN2 served as loading control. (G and H) Graphs represent protein amounts of CSNK2 subunits which were analyzed before by western blot (F). Note, in response to the absence of Csnk2b, protein amounts of CSNK2A1 and CSNK2A2 subunits are delicately balanced and seem to be adjusted in a muscle-type specific manner. (I) To determine the capacity of mitochondria for importing precursor proteins the in organello import assay with radiolabeled precursor proteins was used.Citation72 [35S]-radiolabeled yeast proteins Cox4, Mdh1 and Atp2 were individually imported into mitochondria (Δψ, membrane potential). Mitochondria were treated with proteinase K and analyzed by SDS-PAGE. p, precursor; m, mature. Import into mitochondria after the longest import time was set to 100% (control). Note, all mitochondrial precursor (p) proteins are imported into mitochondria and processed to shorter mature (m) size with similar time kinetic between control and the csnk2b∆/∆, HSA-Cre indicating mitochondrial protein import in vitro being unaffected. (J) Mitochondria were isolated from skeletal muscles of adult wild-type or csnk2b∆/∆, HSA-Cre mice and equal amounts of native TOMM complexes were resolved by blue-native gels (BN) which are used to separate native protein complexes. After western blot, different TOMM family members within native TOMM complexes were detected by specific antibodies as shown by representative images. The amount of these TOMM family members is similar between TOMM complexes from mitochondria of wild-type or csnk2b∆/∆, HSA-Cre muscles, indicating proper biogenesis of TOMM complexes.](/cms/asset/09be7583-a709-4f1c-b799-7fdb4755a5d7/kaup_a_1403716_f0003_b.gif)
Figure 4. PINK1 accumulates as a full-length 65-kDa protein in csnk2b∆/∆, HSA-Cre diaphragms and preferentially binds to phosphomimetic TOMM22. (A) Representative immunoblot images showing that diaphragms of csnk2b∆/∆, HSA-Cre mice in comparison with controls contain less of processed PINK1 (53 kDa) and more of the full-length PINK1 (65 kDa). (B) Protein levels of unprocessed and processed PINK1 as shown in (A) were quantified by ImageJ and normalized to ACTN2. N = 3 mice per genotype. SDS-PAGE and western blot was repeated 3 to 5 times per protein lysate. (C) Representative western blot membrane images demonstrated interaction of PINK1 with all TOMM receptors, TOMM20, 22, 70, and the import channel TOMM40. GFP-T7 was used as a negative control. (D) Western blot membrane image demonstrated that the mitochondrial targeting sequence (MTS, spanning the area from amino acid 1 to 94) of PINK1 interacts with TOMM22. (E) Representative TOMM22 immunoblot images of GST affinity isolations. GST-PINK1-MTS was utilized to affinity isolate individually wild-type, inactive alanine- or phosphomimetic-TOMM22 mutants. Note, TOMM22S15D,T43D or TOMM22S15E,T43E bound significantly stronger to PINK1-MTS in comparison with wild-type TOMM22 or TOMM22S15A,T43A. N = 3 independent experiments. (F) Protein levels of wild-type and mutant TOMM22 as shown in (E) were quantified using ImageJ, normalized to 1/10 input. Note, PINK1 bound significantly more phosphomimetic TOMM22, than wild-type or alanine-mutant TOMM22 proteins.
Figure 5. Mitochondria from csnk2b∆/∆, HSA-Cre muscles display impaired mitophagy and accumulation of endogenous and radiolabeled PINK1 at mitochondrial outer membranes. (A) Representative immunoblot images of muscle lysates after immunoprecipitation of MFN2, SDS-PAGE, and western blot are shown. Note, more ubiquitinated MFN2 was detected in csnk2b∆/∆, HSA-Cre diaphragm, and more PARK2 coprecipitated with MFN2 from csnk2b∆/∆, HSA-Cre muscle lysates. (B) Representative immunoblot images of muscle lysates from control and csnk2b∆/∆, HSA-Cre mice probed with antibodies labeling proteins implicated in autophagy, are shown. (C) Phospho-S65-ubiquitinated proteins from diaphragm muscle lysates from control and csnk2b∆/∆, HSA-Cre mice were immunoprecipitated with a phospho-S65-ubiquitin-reactive antibody. The representative immunoblot image shows higher amounts of phospho-S65 ubiquitinated proteins in muscle lysates from csnk2b∆/∆, HSA-Cre mice in comparison with control controls. (D) Mitochondria were isolated from skeletal muscle, lysed and subjected to immunoblot analysis. Cytosolic lysates served as controls, are shown on the same blots, and demonstrate the quality of the mitochondrial fraction. Note, these data confirm the increase of 65-kDa PINK1 in csnk2b∆/∆, HSA-Cre like shown in A where whole diaphragm lysates instead of isolated mitochondria were used. (E) Quantifications of immunoblots, like the representative one shown in (D). N = 3 mice per genotype. Note, isolated mitochondria of csnk2b∆/∆, HSA-Cre muscles possess more of the 65 kDa PINK1, PARK2, OPTN, and SQSTM1. (F) Immunoblot analysis of PINK1 isolated from mitochondria and resolved by BN-PAGE. Note, significantly higher amounts of PINK1 are part of a quaternary 700-kDa PINK1 complex in mitochondria isolated from csnk2b∆/∆, HSA-Cre muscle.
Figure 6. A block of mitophagy flux is involved in the accumulation of SQSTM1-associated cytosolic aggregates in csnk2b∆/∆, HSA-Cre muscles of adult mice. (A) Representative images of SQSTM1-immunostained soleus and tibialis anterior muscle cross-sections. High-resolution images of individual muscle fibers are shown on the right. Note, a higher number of SQSTM1-associated accumulations in cross-sectioned csnk2b∆/∆, HSA-Cre muscle fibers were visible. N = 3 mice per genotype. (B) Graph shows the quantification of grey sum fluorescence intensities of SQSTM1-immunostained cross-sections using ImageJ. (C) Representative electron microscopy images of csnk2b∆/∆, HSA-Cre muscle fibers showing autophagosomes containing mitochondria (capital ‘M’). Mitochondria outside of vacuoles are labeled by a lowercase ‘m’. (D) Autophagosomes were quantified in control and csnk2b∆/∆, HSA-Cre muscle fibers and are represented as a graph. N = 3 mice per genotype; 5 to 10 fibers were used for quantification for each of the muscles. Data are presented as mean ± s.e.m. (E) Flux of mitophagy was analyzed by electroporation of a reporter plasmid (mt-mKEIMA) into flexor digitorum brevis muscles of adult control and csnk2b∆/∆, HSA-Cre mice, changes of fluorescent spectra were detected and summarized by the presented graph. (F) Representative immunoblot images of muscle lysates from fed and starved adult 6- to 8-month-old control and csnk2b∆/∆, HSA-Cre mice. After SDS-PAGE and western blot, membranes were probed with antibodies labeling proteins implicated in autophagy, namely MAP1LC3B and SQSTM1. (G) Quantification of protein bands as seen in (F) using Image J. For normalization, ACTN2 was used. N = 3 mice per genotype. (H) Representative immunoblot images of mitochondria isolated from muscles from 3 different mice per genotype after colchicine treatment. After SDS-PAGE and western blot, membranes were probed with antibodies labeling proteins implicated in autophagy, namely MAP1LC3B-II, SQSTM1, and PARK2. Note, the increased amount of PARK2 refers to impaired mitophagy in csnk2b∆/∆, HSA-Cre muscles, while high amounts of SQSTM1, even in the absence of colchicine, indicate a block of mitophagy flux. (I) Quantification of protein bands as seen in (H) by ImageJ. VDAC1/2 served as a loading control.
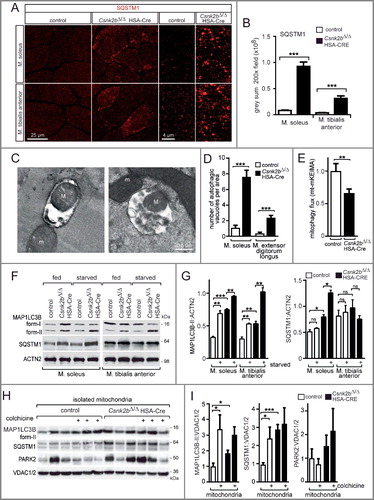
Figure 7. Phosphomimetic and inactive TOMM22 proteins correlate with the number of SQSTM1-associated accumulations and oxygen consumption rates in Csnk2b ablated muscle cells. (A) Representative images of SQSTM1 immunostain of longitudinal sections of soleus muscle which were electroporated in vivo with phosphomimetic TOMM22 and shRNA transcribing plasmids to knockdown endogenous Tomm22. Note, a higher number of SQSTM1-associated accumulations was visible in csnk2b∆/∆, HSA-Cre soleus muscle fibers. This number decreased in csnk2b∆/∆, HSA-Cre muscle fibers which were electroporated with a phosphomimetic TOMM22 mutant (TOMM22S15E,T43E); but not after electroporation with wild-type TOMM22. Contemporary electroporation of an RFP-nuclear localization signal (nls) expression plasmid served for identification of the electroporated muscle fiber areas. (B) Quantification of the number of SQSTM1-associated accumulations in control or csnk2b∆/∆, HSA-Cre muscle cells which were electroporated with either wild-type or phosphomimetic TOMM22. N = 3 mice per genotype. Note that expression of phosphomimetic TOMM22 lowered the number of SQSTM1-associated accumulations in csnk2b∆/∆, HSA-Cre muscle fibers to almost wild-type levels. (C and D) Cultured C2C12 muscle cells were transfected with shRNA to knock down endogenous Tomm22 expression and with either wild-type or inactive Tomm22 expression plasmids. Cells were then immunostained for SQSTM1, DAPI and monitored for GFP expression encoded by shRNA transcribing plasmids. N = 3 independent experiments. (C). Note, the number of SQSTM1-associated aggregates is significantly higher in muscle cells expressing TOMM22S15A,T43A in comparison with wild-type TOMM22 (C). Number of SQSTM1-associated aggregates per cell was quantified and is depicted as graph (D). (E) Cultured primary muscle cells were untransfected or transfected with Tomm22 wild-type or Tomm22S15E,T43E expression plasmids, both together with shRNA plasmid to reduce endogenous Tomm22 expression, lysed, resolved by SDS-PAGE, western blotted, and membranes were immunostained with antibodies specific for different mitochondrial proteins. Representative images of immunostains demonstrated that the decreased mitochondrial protein amount in csnk2b∆/∆, HSA-Cre muscle cells, in comparison with controls, was rescued to normal values by transfection of a phosphomimetic TOMM22 mutant. (F) Quantification of protein bands as seen in (E) using ImageJ. All numbers were normalized to ACTN2. N = 3 independent experiments. (G) Graphs show oxygen consumption rates (OCR) in C2C12 cells which were transfected with expression plasmids encoding wild-type Tomm22 or inactive Tomm22S15A,T43A, together with GFP, and FACS sorted prior to OCR measurement by Seahorse methodology. N = 3 independent experiments. (H) OCRs measured with cultured primary muscle cells from wild-type or csnk2b∆/∆, HSA-Cre mice. Cells were transfected with expression plasmids as indicated, together with a GFP expression plasmid. Like in (G), transfected cells were FACS sorted by their fluorophore prior to Seahorse measurements. Note, constitutively expressed Cre recombinase was transfected to all cells to ensure deletion of floxed Csnk2b in csnk2b∆/∆, HSA-Cre muscle cells which occurred 48 to 72 h prior to the seahorse measurements.
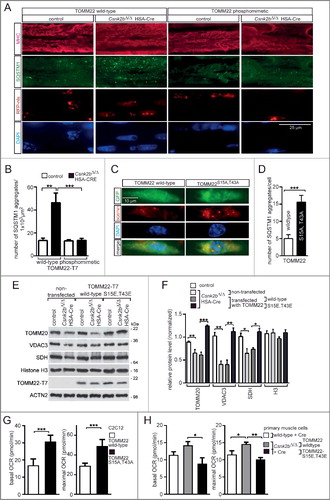
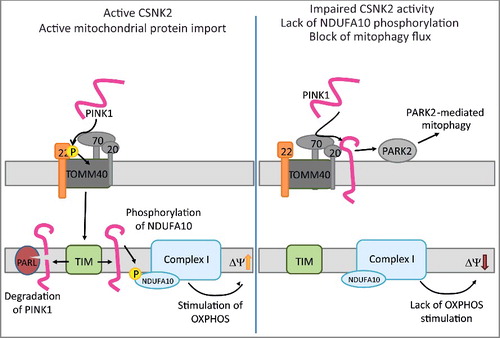
Figure 8. Sketch hypothesizes a mechanism for impaired mitochondrial homeostasis and mitophagy in wild type and csnk2b∆/∆, HSA-Cre muscle fibers. (Left) TOMM22 in its phosphorylated state facilitates import of PINK1 into the inner mitochondrial membrane. PINK1 in the inner membrane will be degraded by PARL, but also lead via phosphorylation of NDUFA10 to the stimulation of oxidative phosphorylation (OXPHOS) activity. Note, it remains to be determined whether PINK1 directly phosphorylates NDUFA10. (Right) In csnk2b∆/∆, HSA-Cre cells, lack of phosphorylated TOMM22 impairs PINK1 import and induce PARK2-mediated mitophagy. In addition, the lack of NDUFA10 phosphorylation will reduce OXPHOS activity and therefore lower the membrane potential of mitochondria. We speculate that accordingly loss of TOMM22 phosphorylation fosters PINK1 to accumulate on the outer membrane of mitochondria.