Figures & data
Figure 1. Mitophagy is induced in HK-2in response to ATP depletion-repletion. (A-D) HK-2 cells were incubated in RKRB buffer containing 20 µm CCCP for 2∼6 h to induce ATP depletion, followed by recovery in normal cell culture medium for another 2 h (ATP repletion). Control (Ctrl) cells were cultured in normal medium without ATP depletion. Whole cell lysates were collected for immunoblot analysis of LC3B-I/II, SQSTM1, TIMM23, TOMM20 and ACTB (loading control). (A) Representative blots. (B, C, D and E) Densitometry of LC3B-II (B), SQSTM1 (C), TIMM23 (D), and TOMM20 (D)signals. For densitometry, the protein level of the control group was arbitrarily set as 100% in each blot, and the signals of other conditions in the same blot were normalized with the control to indicate their protein expression levels. Error bars: SEM, n = 3. *p<0.05; **p<0.01; ***p<0.001; ns, not significant.(E) Representative images of mitophagosome. HK-2 cells were transientlyco-transfected with GFP-LC3B and pDsRed-Mito plasmids. At 24 h aftertransfection, cells were treated with either solvent (DMSO; Control) or 20 µm CCCP in RKRB for6 h followed by recovery for another 2 h (ATP D-R). The cells were then fixed for confocal microscopy analysis for mitophagosome formation as assessed by colocalization of GFP-LC3B-positive autophagosomes (green) with pDsRed-Mito-labeled mitochondria (red). Nuclei were stained with DAPI (blue). Bar: 20 μm.
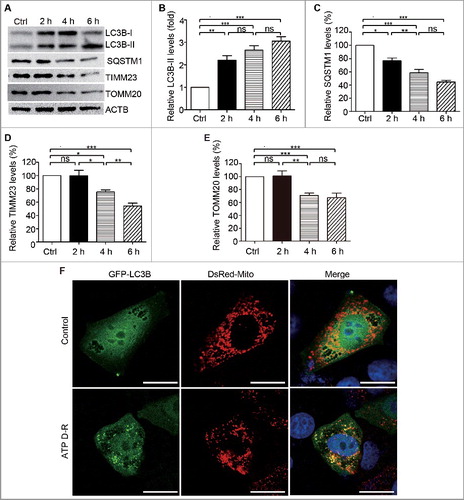
Figure 2. PINK1 and PRKN/PARK2 participate in ATP depletion-repletion-induced mitophagy in HK-2 cells. (A-C) HK-2 cells were subjected to ATP depletion-repletion (ATP D-R) as in , and whole cell lysates were collected for immunoblot analysis of PINK1, PARK2, and ACTB. (A) Representative blots. (B, C) Densitometry of PINK1 and PARK2. (D,E) Silencing of PINK1 or PRKNinhibits ATP D-R-inducedmitophagosome formation. HK-2 cells were first transfected with PINK1siRNA, PRNKsiRNA,or control siRNA(CtrlsiRNA),and 24 h later these cells were cotransfected with plasmids encoding GFP-LC3B and pDsRed-Mito. After another 24 h, the cells were subjected to 6 h of ATP depletion followed by 2 h of ATP repletion. Finally, the cells were stained with DAPI (blue) and fixed for confocal microscopy analysis. (D) Representative images. Bar: 20 μm. (E) Quantitative analysis of mitophagosome formation. Over 200 cells positive for both GFP-LC3B and DsRed-Mito in each group were counted for those with colocalization of GFP-LC3B-positive autophagosomes and pDsRed-Mito-labeled mitochondria. (F and G) Silencing of PINK1andPRKN partially restores TIMM23 levels in HK-2 following ATP D-R. HK-2 cells were transfected with PINK1siRNA and PRKNsiRNA alone or both (Double), or CtrlsiRNA. At 48 h after transfection, the cells were subjected to 6 h of ATP depletion followed by 2 h of reperfusion, and whole cell lysates were collected for immunoblot analysis of TIMM23, LC3B-I/II, and ACTB. (F) Representative blots. (G) Densitometry of TIMM23.(H and I) Silencing of PINK1inhibits ATP D-R-induced mitochondrial translocation of PARK2. HK-2 cells were transfected with CtrlsiRNAandPINK1siRNA, and 24 h later the cells were further cotransfected with GFP-PARK2 and DsRed-Mito plasmids. After another 24 h, cells were subjected to ATP D-R. Finally, the cells were stained with DAPI (blue nuclei) and fixed for confocal microscopy. (H) Representative images. Bar: 20 μm.(I) Quantitative analysis of mitochondrial translocation of PARK2. Greater than 200 cells positive for both GFP-PARK2 and DsRed-Mito in each group were analyzed to determine the percent of cells showingPARK2 on mitochondria.Error bars: SEM, n = 3. *p<0.05; **p<0.01; ***p<0.001; ns, not significant.
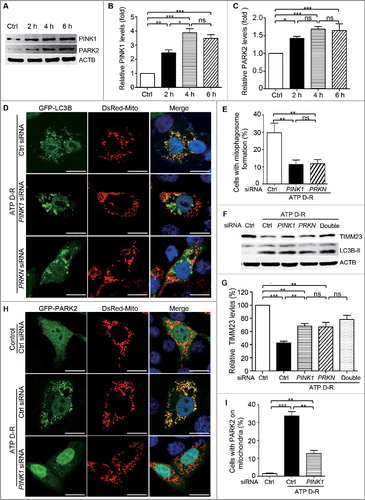
Figure 3. Silencing of PINK1andPRKN sensitizes HK-2 cells to ATP depletion-repletion-induced apoptosis. HK-2 cells were transfected with controls iRNA(CtrlsiRNA), PRKNsiRNA, orPINK1siRNA. At 48 h after transfection, cells were subjected to 6 h of ATP depletion followed by2 h of repletion (ATP D-R). Apoptosis was assessed by nuclear morphology, TUNNEL assay and CASP3 activation. (A) Representative nuclear morphology and TUNNEL assay (× 200). (B) Apoptosis percentage. Greater than 200 cells in each group were evaluated to determine the percentage of TUNNEL-positive cells. (C) Whole cell lysates were collected for immunoblot analysis of activated CASP3and ACTB. (D) Densitometry of activated CASP3. The signal of activated CASP3 was normalized to the ACTB signal of the same samples to determine the ratios with control (Ctrl) set as 1. Error bars: SEM, n = 3. *p<0.05; **p<0.01; ***p<0.001; ns, not significant.
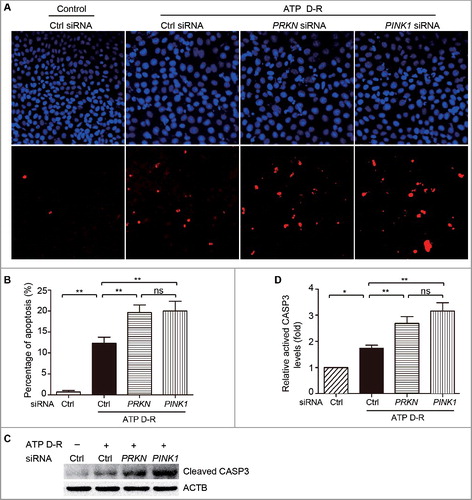
Figure 4. Mitophagy is induced in proximal tubular cells after renal ischemia-reperfusion in mice. C57BL/6 wild-type mice (male, 8–10-wk old) were subjected to 30 min of bilateral renal ischemia followed by 48 h of reperfusion (I-R) or sham operation (Sham). Renal cortex and outer medullawere collected for immunoblot analyses of LC3B-I/II, TIMM23, TOMM20, PINK1, PARK2 and PPIB (loading control), for mitochondrial DNA content analysis, and for transmission electronic microscopyanalysis. (A) Representative blots. (B-E) Densitometry of LC3B-II (B), TIMM23 (C), TOMM20 (D), PINK1 (E) and PARK2 (F) signals. The signal of each protein of the I-R samples was divided by that of the sham control that was arbitrarily set as 1. (G) Relative mitochondrial DNA content (mtDNA:nDNA). (H) Representative TEM images of autophagosomes (pointed to by the arrowhead in the left panel) and a mitophagosome (pointed to by the arrowhead in the right panel) in renal proximal tubule cells after I/R. Error bars: SEM, n = 3. *p<0.05; **p<0.01; ***p<0.001; ns, not significant.
Figure 5. Pink1 and/orPark2 deficiency worsens renal ischemia-reperfusion-induced kidney injury. pink1 knockout (KO), park2 KO, pink1park2double-KO (dKO), and wild-type (WT) mice (male, 8–10-wk old) were subjected to 30 min of bilateral renal ischemia followed by 48 h of reperfusion (I-R) or sham operation (Sham). (A) Blood samples were collected for measurements of serum creatinine.(B) Representative histology of kidney cortex by hematoxylin-eosin (H-E) staining.Bar: 25μm. (C) Pathological score of tubular damage. (D-F) Whole tissue lysate of kidney cortex was collected for immunoblot analysis of HAVCR1, TRP53 and PPIB. (G) Densitometry of HAVCR1and TRP53 signals to compare I-R induction in park2-KO, pink1-KO, and double-KO tissues. The HAVCR1and TRP53 signals were normalized to the PPIB signal of the same samples to determine the ratios. The ratios of park2 KO were arbitrarily set as 1. Error bars: SEM, n = 3. *p<0.05; **p<0.01; ***p<0.001; ns, not significant.
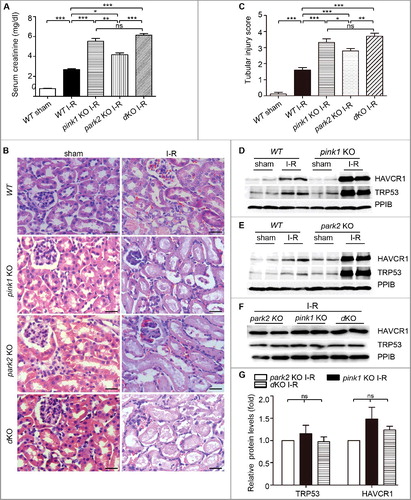
Figure 6. Pink1 and/or Park2 knockout increases tubular cell apoptosis during renal I-R injury. pink1-KO, park2 KO, pink1 and park2 double-KO (dKO) and WT mice were subjected to renal I-R or sham operation (Sham) as in . (A) Representative images of TUNEL staining of kidney tissues. Bar:20 µm.(B) Quantification of TUNEL-positive cells in kidney tissues. (C) Representative images of histochemical staining of activated CASP3 in kidney tissues. Bar:20 µm.(D) Quantification of activated CASP3-positive cells in kidney tissues. Error bars: SEM, n = 3. *p<0.05; **p<0.01; ***p<0.001; ns, not significant.
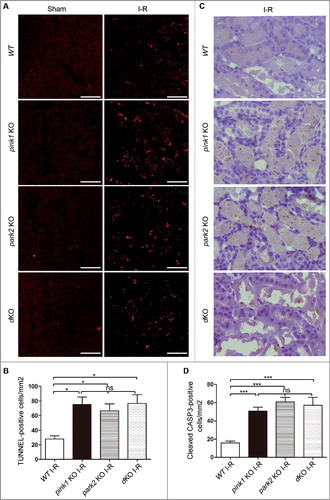
Figure 7. Pink1 and Park2 deficiency enhances inflammatory cell infiltration during renal I-R. pink1 KO, park2 KO, pink1 and park2 double-KO (dKO) and WT mice were subjected to renal I-R or sham operation (Sham) as above. Kidneys were collected and processed for immunohistochemical analysis of neutrophils and macrophages. (A) Representative images of neutrophil staining. Scale bar: 20 μm. (B) Quantification of neutrophil-positive cells. (C)Representative images of macrophage staining. Scale bar: 20 μm. (D) Quantification of neutrophil-positive cells. Error bars: SEM, n = 3. *p<0.05; **p<0.01; ***p<0.001; ns, not significant.
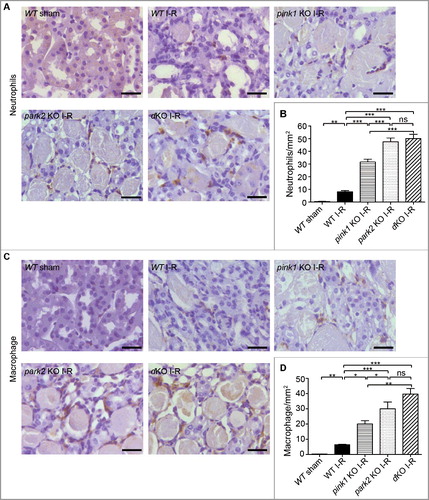
Figure 8. Pink1 and/orPark2 deficiency aggravates renal I-R-induced mitochondrial damage and abrogates renal I-R-induced mitochondrial ubiquitination. (A, B) pink1 KO, park2 KO, pink1 and park2 double-KO(dKO) and WT mice were subjected to renal I-R or sham operation (Sham). Renal cortex was fixed and processed for transmission electron microscopy analysis. (A) Representative TEM images of mitochondrial morphology in proximal tubular cells. Scale bars:2 μm.(B) Quantification of mitochondrial fragmentation. Mitochondrial length was measured in individual tubular cells to determine the percentage of cells in which mitochondria with length> 2 µm was less than 1%. A total of 30 cells in control and 50 cells in ischemic kidneys from 3 animals in each condition were evaluated. (C, D) After renal I-R, renal cortex was collected and fractionated to separate cytosolic (cyto) and mitochondrial (mito) fractions followed by immunoblot analysis of ubiquitin, COX4I1 (mitochondrial marker), and TUBB5 (cytosolic marker). (C) Representative blots. (D) Densitometry of ubiquitin signals. For densitometry, the total signals of ubiquitinated mitochondrial proteins of the sham operation group was arbitrarily set as one in each blot, and the signals of other conditions in the same blot were normalized with the control. Error bars: SEM, n = 3. *p<0.05; **p<0.01; ***p<0.001; ns, not significant.
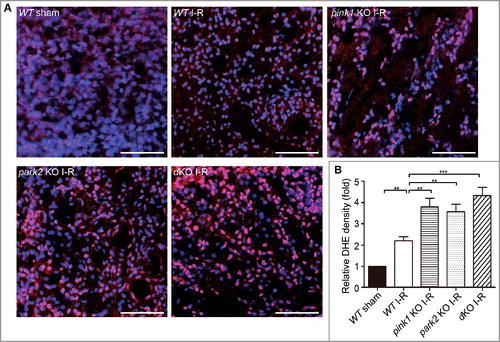
Figure 9. Pink1 and/orPark2 deficiencyenhances renal ischemia-reperfusion-induced ROS production in renal tubular cells. (A) Representative images of dihydroethidium (DHE) staining. pink1 KO, park2 KO, pink1 and park2double-KO (dKO) and WT mice were subjected to renal I-R or sham operation (Sham), and then stained with DHE. DHE nuclear staining indicates the presence of reactive oxygen species (ROS). Scale bar: 20 μm. (B) Quantification of DHE fluorescence intensity. Error bars: SEM, n = 3. *p<0.05; **p<0.01; ***p<0.001; ns, not significant.