Figures & data
Figure 1. Autophagy signaling is involved in NTS-mediated HNC cell death. (A) FaDu and SNU1041 cells were treated with or without NTS for the indicated times in the absence of serum and then each protein level was determined with western blots. (B) NTS induced accumulation of GFP-MAP1LC3-II puncta. The GFP-MAP1LC3-II plasmid was transfected into FaDu cells. After 24 h, NTS treatment was given for the indicated times and GFP-MAP1LC3-II puncta were analyzed by fluorescence microscopy (scale bar: 20 μm). GFP-MAP1LC3-II puncta were observed by fluorescence microscopy in 5 fields captured randomly and the GFP-MAP1LC3-II puncta-positive cells were counted (n = 3; scale bar: 20 μm). Data are means ± SD. Asterisks indicate statistically significant differences (P < 0.05). (C) TEM analysis in NTS-treated cells. FaDu cells were treated with NTS for 24 h, and then autophagic vesicles were observed by TEM (N, nucleus; scale bar: 5,000 nm).
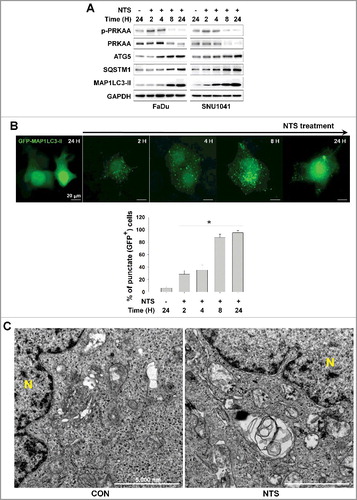
Figure 2. NTS-induced inhibition of HSPA5 expression and its pivotal role in ER stress or autophagy. (A) FaDu cells were treated with NTS for the indicated times and protein levels were evaluated by western blot assay. (B) Inhibition of NTS-induced ER stress prevents autophagy. GFP-MAP1LC3-II plasmids were transfected into FaDu cells and 24 h later, the cells were pretreated with TUDCA (1 mg/ml) for 1 h. NTS treatment was given for 24 h with or without TUDCA in absence of serum. GFP-MAP1LC3-II puncta were analyzed with a fluorescence microscope (scale bar: 50 μm). (C) HSPA5 was decreased in response to NTS. FaDu cells were treated with NTS for 24 h in the absence of serum, and HSPA5 expression was determined by western blot assay (n = 3). (D) HSPA5 overexpression in HNC tissues. Proteins were isolated from frozen tissues of 6 patients with HNC, and HSPA5 expression level was determined by western blot assay (n = 6; C, cancer tissue; N, normal tissue; P, patient). (E) The immunohistochemistry analysis of HSPA5 in cancer or normal (scale bar: 200 μm). (F and G) HSPA5 overexpression inhibited NTS-induced ER stress, autophagy and cytotoxicity. HSPA5 plasmids were transfected into FaDu cells, and the cells were treated with NTS for 24 h in the absence of serum. Protein levels were evaluated by western blot assay (F) and MTT assay (G; n = 6). (C, D and G) Data are means ± SD. Asterisks indicate statistically significant differences (P < 0.05).
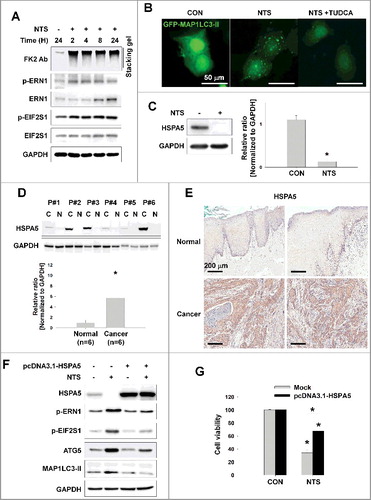
Figure 3. HSPA5 has a pivotal role in NTS-mediated regulation of lysosomal activity. (A) FaDu cells were seeded in a 48-well plate and treated with NTS for the indicated times. Cells viability was measured by the MTT assay (n = 6). Data are means ± SD. Asterisks indicate statistically significant differences (P < 0.05). (B) FaDu cells were treated with or without NTS for 24 h in the absence of serum and lysosomal activity was measured by FACS analysis (n = 3). Data are means ± SD. Asterisks indicate statistically significant differences (P < 0.05) (*, vs O H). (C) GFP-MAP1LC3-II puncta was accumulated by inhibiting lysosomes. NH4Cl (10 mM), E-64 (10 μM), and NTS were added to GFP-MAP1LC3-II-transfected cells for 24 h in the absence of serum. GFP-MAP1LC3-II puncta were observed by fluorescence microscopy. Scale bar: 20 μm. (D) HSPA5 overexpression inhibits NTS-induced downregulation of lysosome-related proteins or gene expression. FaDu cells were transfected with or without pcDNA3.1-HSPA5 for 24 h, and then cells were treated with NTS for the indicated times. The indicated proteins or gene expression were determined by western blot assay or RT-PCR. (E to G) HSPA5 overexpression inhibits NTS-induced downregulation of lysosomal activity. HSPA5-transfected or nontransfected cells were treated with NTS for 24 h and then lysosomal activity was assessed with FACS analysis (E), TFEB transcription factor activity assay (F) or CTSD (cathepsin D) activity assay (G). (E, F and G) Data are means ± SD. Asterisks indicate statistically significant differences (n = 3, P < 0.05).
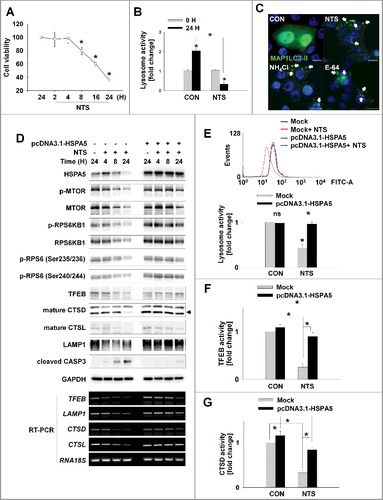
Figure 4. HSPA5 inhibits NTS-induced apoptosis through intracellular ROS control. (A) NTS-induced cytotoxicity was prevented by the caspase protease inhibitor, Z-VAD-FMK. FaDu cells were pretreated with Z-VAD-FMK (10 μM) for 1 h and then the NTS treatment was given for a further 24 h. Cell viability was assessed by MTT assay. Data are means ± SD. Asterisks indicate statistically significant differences (n = 6, P < 0.05). (B and C) HSPA5-transfected cells exhibited inhibition of NTS-induced mitochondrial apoptosis signaling and the alleviation of MMP alteration. FaDu cells were transfected with or without pcDNA3.1-HSPA5 for 24 h and then NTS treatment was given for 24 h. The indicated protein levels were determined by western blot (B) and MMP alteration was evaluated by JC-1 assay (C, healthy, red; apoptotic, green). JC-1-stained live cells were observed by fluorescence microscopy in 5 fields captured randomly and red/green fluorescent density ratio was quantified (n = 3; scale bar: 20 μm). Data are means ± SD. Asterisks indicate statistically significant differences (P < 0.05). (D) The ROS increment induced by NTS was inhibited by HSPA5 overexpression. NTS treatment was given to pcDNA3.1-HSPA5-transfected or nontransfected cells for 24 h and then intracellular ROS levels were determined by FACS analysis (n = 3). Data are means ± SD. Asterisks indicate statistically significant differences (P < 0.05). (E and F) NTS induced translocation of HSPA5 to mitochondria. (E) FaDu cells were seeded on cover-slips and then NTS treatment was given for 8 h in the absence of serum. After cell fixing, mitochondria (green) or endogenous HSPA5 (red) were stained with anti-TOMM20 or anti-HSPA5 antibodies. Green and red signal intensity was measured by confocal microscopy (allow). (F) NTS treatment was given to FaDu cells for the indicated times. After cellular fractionation, HSPA5 levels were assessed by western blot (Whole: whole cells lysate; cyto, cytosolic fraction; mito, mitochondria fraction).
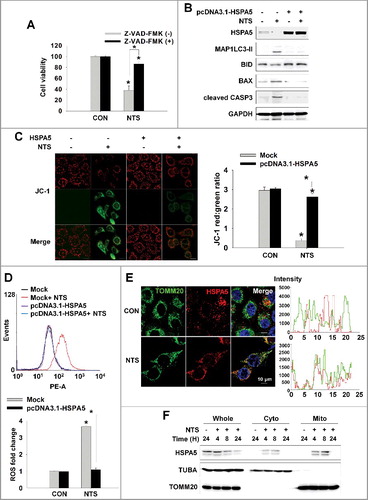
Figure 5. MUL1 negatively regulates HSPA5. (A) NTS induced ubiquitination of HSPA5. NTS treatment was given to FaDu cells for 24 h, in the absence of serum and MG132 (10 μM) was included for 8 h before cell harvest. Endogenous HSPA5 was immunoprecipitated by an anti-HSPA5 antibody and the determination of ubiquitin-conjugated HSPA5 was performed with an anti-ubiquitin antibody. (B) NTS induced UPS of HSPA5. FaDu cells were treated with NTS for each indicated time. A pretreatment of MG132 (10 μM) was given for 1 h before the NTS treatment. Endogenous HSPA5 or MUL1 was evaluated by western blot assay. (C and D) MUL1 knockdown inhibited NTS-mediated HNC cellular events or HSPA5 ubiquitination. FaDu cells were transfected with scrambled RNAs or MUL1 siRNA and 24 h later, NTS treatment was given for 24 h in the absence of serum. The cells were subjected to western blot assay with the indicated antibodies (C) or Ni-NTA His affinity-isolation ubiquitination assay (D). (E) MUL1 knockdown prevented NTS-induced lysosome inhibition. NTS treatment was given for 24 h to scrambled RNA- or MUL1 siRNA-transfected cells. Lysosomal activity was assessed with FACS analysis (n = 3). Data are means ± SD. Asterisks indicate statistically significant differences (P < 0.05). (F) MUL1 was suppressed in HNC regions. MUL1 expression in HNC patients was analyzed by immunohistochemistry using anti-MUL1 antibody. (G) HSPA5 or MUL1 expression levels were different between tissues from cancer patients or healthy controls. Proteins were isolated from tissues of 14 patients with HNC, and HSPA5 or MUL1 expression levels were determined by western blot (C, cancer tissue; N, normal tissue; P, patient). Data are means ± SD. Asterisks indicate statistically significant differences (P < 0.05).
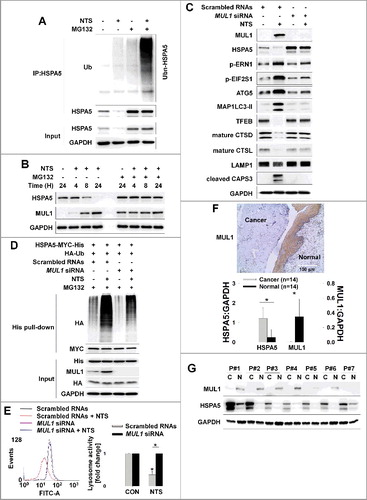
Figure 6. Lysine 446 of HSPA5 is a site of MUL1-mediated K48-linked ubiquitination. (A) HSPA5 interacted with MUL1. At 24 h after cotransfection with the indicated plasmids, FaDu cells were treated with MG132 (10 μM) for 8 h before cell harvest and then subjected to immunoprecipitation with an anti-GFP antibody, followed by western blot with the indicated antibodies. (B) MUL1 induced K48-linked ubiquitination of HSPA5. FaDu cells were cotransfected with plasmids as indicated. At 24 h after cotransfection, cells were treated with MG132 (10 μM) for 8 h and further subjected to ubiquitination assay. (C) K446 is a putative ubiquitination site for MUL1. Each indicated plasmid was transfected into FaDu cells together with or without EGFP-MUL1 and 24 h later, cells were treated with MG132 (10 μM) for 8 h and further subjected to Ni-NTA His affinity-isolation ubiquitination assay. (D) The effect of MUL1 on HSPA5 protein stability was inhibited in the HSPA5K446R mutant, compared to wild-type HSPA5. K446R mutant was inhibited MUL1-dependent protein stability compared with wild type of HSPA5. WT HSPA5-MYC-His or HSPA5K446R-MYC-His plasmids were transfected into FaDu cells together with or without EGFP-MUL1 dose dependently and 24 h later, the level of each indicated protein was determined by western blot. (E) The half-life of the K446R mutant protein was compared with the wild type of HSPA5. WT HSPA5-MYC-His or HSPA5K446R-MYC-His plasmids were transfected into BEAS-2B cells and 24 h later, treatment with CHX (20 μg/ml) was included for each indicated time. Endogenous MUL1 or exogenous HSPA5 were detected using anti-MUL1 or anti-MYC antibodies. (F) K446R did not induce ubiquitination from the NTS. Cells transfected with each indicated plasmid, were treated with NTS for 24 h and the ubiquitinated form of HSPA5 was detected by Ni-NTA His affinity isolation assay.
Figure 7. MUL1 KO HNC cells show resistance to NTS treatment in a xenograft in vivo model. Human FaDu (5 × 10⁶ cells) HNC cells were injected subcutaneously into BALB/c nu/nu mice and the mice were treated with NTS every day for 14 d (PBS, n = 5; NTS, n = 8). Tumor volume and images are shown in Figure S12A. (A) Immunohistochemical analysis of HSPA5, p-AKT, MAP1LC3-II, TFEB, LAMP1, and cleaved CASP3 (scale bar: 100 μm). Protein levels were analyzed and quantified by western blot assay in Figures S12B. (B) NTS induced increases in level of the interaction between MUL1 and HSPA5 in NTS-treated mice tumors. The interaction of MUL1 and HSPA5 induced by NTS was assessed by PLA in mice tissues. Arrows indicate PLA-positive (+) cells (scale bar: 60 μm). Numbers of PLA (+) cells were counted at x200 magnification in 5 randomly chosen fields. Data are means ± SD. Asterisks indicate statistically significant differences (P < 0.05). The distribution of PLA (+) cells in whole tumor (Figure S13A) or immunostaining between HSPA5 and MUL1 (Figure S13B) is represented in Figure S13. (C) TEM of NTS-treated tumor. Arrows indicate autophagic vesicles (scale bar: 2,000 nm). (D) MUL1 knockout (KO) HNC cells showed resistance to NTS treatment. MUL1 KO cells were generated by the CRISPR/Cas9 system (Figure S14A to S14E). FaDu cells with wild-type MUL1 (WT) or MUL1 KO (each 5 × 10⁶ cells) were injected subcutaneously into BALB/c nu/nu mice and the mice were treated with NTS every day for 15 d. Data are means ± SD. Asterisks indicate statistically significant differences (P < 0.05). (E) Immunohistochemical analysis of MUL1 or HSPA5 in tumors (scale bar: 100 μm). MUL1- or HSPA5-positive stain intensity was measured and quantified by ImageJ program. Data are means ± SD. Asterisks indicate statistically significant differences (P < 0.05).
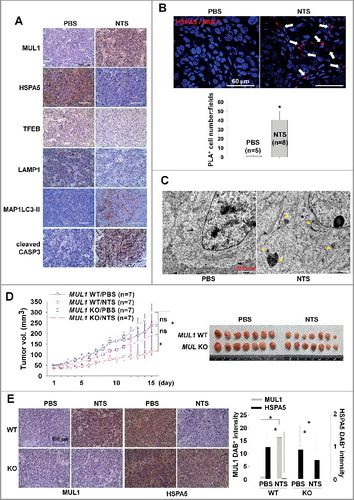
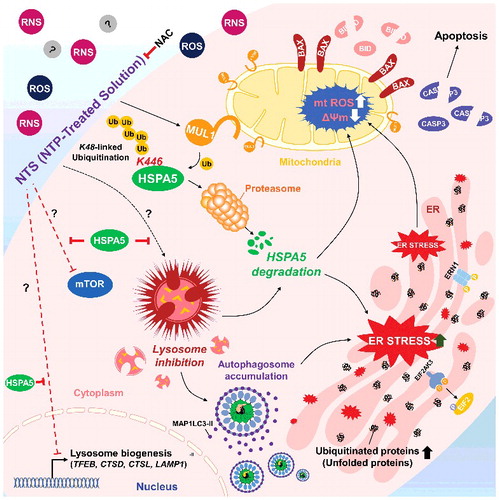
Figure 8. Schema of the MUL1-HSPA5 axis in HNC. HSPA5 shows a protective mechanism through control of lysosomal activity; however, NTS-mediated MUL1 induces HSPA5 ubiquitination at the K446 residue and leads to alteration in the signal from survival to apoptosis, through lysosome inhibition. NAC, N-acetylcysteine.