Figures & data
Figure 1. MIR30D is downregulated in vitro and in vivo. (A) Heat map indicates the differential expressions of microRNAs in HBMECs between control and Meth-treated groups. MIR30D expression is downregulated in HBMECs. Down- and upregulated genes are indicated by green and red, respectively. (B) Scatter plot represents the visualization method used to assess variations in microRNA expression between control and Meth-treated groups. The values for the X and Y axes represent normalized signal values (log10 scale). 6 h after the treatment of HBMECs with Meth (100 μM), RNA was extracted and pooled from triplicate samples in each control and Meth-treated group. (C and D) Effect of Meth or LPS on MIR30D expression in HBMECs. HBMECs were treated with Meth (100 μM) or LPS (10 ng/ml) for 6 h, followed by RNA extraction. All data are presented as the mean ± SD of 4 independent experiments. *P<0.05 vs. vehicle control using the Mann-Whitney test. (E) Effect of LPS on Mir30D expression in the hippocampus of mice. Mice were treated with saline or LPS (0.83 mg/kg) once per day for 7 d. n = 6 animals/group. **P<0.01 vs. saline group using the Mann-Whitney test. (F) Relative luciferase activity of wild-type and 3'-UTRΔ mutant constructs of ATG5 cotransfected with a MIR30D overexpression vector and pmiR-GLO plasmid. All data are presented as the mean ± SD of 3 individual experiments. *P<0.05 vs. the MIRCon cotransfected with the WT construct via one-way ANOVA followed by the Holm-Sidak test. (G) MIR30D regulated the expression of ATG5 in HBMECs. Representative western blots indicate the ATG5 expression in HBMECs exposed to MIR30D or anti-MIR30D lentivirus. All data are presented as the mean ± SD of 5 independent experiments. **P<0.01 vs. MIRCon group or anti-MIRCon group using the Mann-Whitney test. HBMECs: human brain microvascular endothelial cells; Meth: methamphetamine.
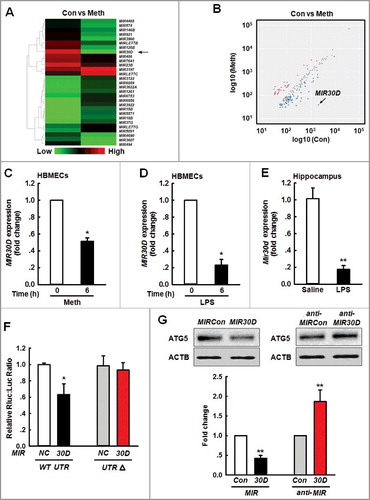
Figure 2. Effects of different concentrations of LPS on the expression of autophagy-associated proteins. (A and B) Effects of LPS (10 ng/ml) on the expression of BECN1 and ATG5 (A), MAP1LC3B-II and SQSTM1 (B). Cells were treated with LPS (10 ng/ml) for different time points. (C) Effects of LPS (100 ng/ml) on the expression of MAP1LC3B-II and SQSTM1. Cells were treated with LPS (100 ng/ml) for different time points. All data are presented as the mean ± SD of 4 independent experiments. *P<0.05, **P<0.01, ***P<0.001 vs. vehicle control using one-way ANOVA. (D and E) Effects of LPS on RFP- and GFP-MAP1LC3B puncta (D). HBMECs transduced with the RFP-GFP-MAP1LC3B adenovirus and subsequently treated with different concentrations of LPS for 24 h. The RFP- and GFP-MAP1LC3B puncta per cell were counted, and the quantification is shown in (E). Scale bar: 5 μm. Quantification of cell numbers is presented as the mean ± SD of 3 independent experiments. ***P<0.001 vs. vehicle control. ###P<0.001 vs. the LPS (10 ng/ml)-treated group using one-way ANOVA followed by the Holm-Sidak test. (F) Effect of LPS on the MAP1LC3B-II expression. HBMECs were treated with LPS (100 ng/ml) for 24 h. A lysosomal inhibitor mix (NH4Cl [20 mM], Leu [200 μM]) was added 1 h prior to cell harvesting, and the cell lysate was collected and analyzed via immunoblotting for MAP1LC3B-II accumulation. ***P<0.001 vs. vehicle control. ###P<0.001 vs. the LPS (100 ng/ml)-treated group using one-way ANOVA followed by the Holm-Sidak test. (G) Expression of ATG5, MAP1LC3B-II and SQSTM1 in the hippocampus isolated from mice treated with LPS. C57BL/6J mice were treated with LPS (0.83 mg/kg) or saline once per day for 7 d followed by determination of the expression of autophagic proteins. n = 6 animals/group. *P<0.05, **P<0.01 vs. saline group using the Mann-Whitney test. Leu, leupeptin.
![Figure 2. Effects of different concentrations of LPS on the expression of autophagy-associated proteins. (A and B) Effects of LPS (10 ng/ml) on the expression of BECN1 and ATG5 (A), MAP1LC3B-II and SQSTM1 (B). Cells were treated with LPS (10 ng/ml) for different time points. (C) Effects of LPS (100 ng/ml) on the expression of MAP1LC3B-II and SQSTM1. Cells were treated with LPS (100 ng/ml) for different time points. All data are presented as the mean ± SD of 4 independent experiments. *P<0.05, **P<0.01, ***P<0.001 vs. vehicle control using one-way ANOVA. (D and E) Effects of LPS on RFP- and GFP-MAP1LC3B puncta (D). HBMECs transduced with the RFP-GFP-MAP1LC3B adenovirus and subsequently treated with different concentrations of LPS for 24 h. The RFP- and GFP-MAP1LC3B puncta per cell were counted, and the quantification is shown in (E). Scale bar: 5 μm. Quantification of cell numbers is presented as the mean ± SD of 3 independent experiments. ***P<0.001 vs. vehicle control. ###P<0.001 vs. the LPS (10 ng/ml)-treated group using one-way ANOVA followed by the Holm-Sidak test. (F) Effect of LPS on the MAP1LC3B-II expression. HBMECs were treated with LPS (100 ng/ml) for 24 h. A lysosomal inhibitor mix (NH4Cl [20 mM], Leu [200 μM]) was added 1 h prior to cell harvesting, and the cell lysate was collected and analyzed via immunoblotting for MAP1LC3B-II accumulation. ***P<0.001 vs. vehicle control. ###P<0.001 vs. the LPS (100 ng/ml)-treated group using one-way ANOVA followed by the Holm-Sidak test. (G) Expression of ATG5, MAP1LC3B-II and SQSTM1 in the hippocampus isolated from mice treated with LPS. C57BL/6J mice were treated with LPS (0.83 mg/kg) or saline once per day for 7 d followed by determination of the expression of autophagic proteins. n = 6 animals/group. *P<0.05, **P<0.01 vs. saline group using the Mann-Whitney test. Leu, leupeptin.](/cms/asset/6da73de4-5317-44b4-b7f2-52f1112d5f0e/kaup_a_1414755_f0002_c.jpg)
Figure 3. Role of ATG5 in LPS-induced EndoMT. (A and B) Effects of LPS treatment on the expression of TJP (TJP1, OCLN and CLDN5) (A) and mesenchymal cell markers (COL1A2 and ACTA2) (B) in vivo. (C) The number of Dil-labeled monocytes increased out of the blood vessels of LPS-treated TEK-GFP transgenic mice compared with that in the saline treatment. Mice were treated with LPS (0.83 mg/kg) once per day for 7 d and were subsequently accessed via TPLSM. Scale bar: 50 μm. (D and E) Effect of LPS on the GFP+ and ACTA2 colocalization in vivo. Immunostaining for ACTA2 in the hippocampus from TEK-GFP transgenic mice. Z-tack images were acquired on a Carl Zeiss confocal laser scanning microscope (D). The Pearson correlation or Manders overlap of the GFP+ and ACTA2 immunofluorescence was calculated, respectively (E). Scale bar: 5 μm. Mice were administered LPS (0.83 mg/kg) once per day for 7 d. n = 6 animals/group. *P<0.05, **P<0.01, ***P<0.001 vs. saline group using the Mann-Whitney test. (F and G) Transfection of HBMECs with siRNA ATG5 significantly inhibited the decreases in the TJP expression levels (F) and the increases in the mesenchymal cell marker expression (G). HBMECs were cultured for 24 h after the transfection of ATG5 siRNA and were subsequently exposed to LPS (10 ng/ml) for 24 h. All data are presented as the mean ± SD of 3 independent experiments. *P<0.05, **P<0.01, ***P<0.001 vs. the siRNA-control group. #P<0.05, ##P<0.01 vs. the LPS-incubated siRNA-control via one-way ANOVA followed by the Holm-Sidak test.
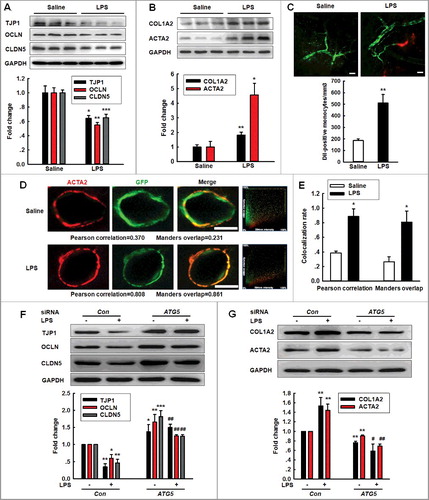
Figure 4. The MIR30D-ATG5 axis plays an important role in the EndoMT. (A and B) Transduction of HBMECs with MIR30D lentivirus significantly inhibited the LPS-induced decreases in the TJP expression levels (A) and increases in the mesenchymal cell marker expression (B). HBMECs were transduced with the MIR30D lentivirus for 24 h and were subsequently incubated with LPS (10 ng/ml) for 24 h. All data are presented as the mean ± SD of 3 independent experiments. *P<0.05, **P<0.01, ***P<0.001 vs. the MIRCon group. #P<0.05, ##P<0.01, ###P<0.001 vs. the LPS-treated MIRCon group via one-way ANOVA followed by the Holm-Sidak test. (C and D) Transduction of HBMECs with the ATG5 siRNA significantly inhibited the decreases in the TJP expression levels (C) and the increases in the mesenchymal cell marker expression (D) induced by anti-MIR30D. HBMECs were cotransduced with anti-MIRCon or anti-MIR30D and either control siRNA or ATG5 siRNA for 24 h. All data are presented as the mean ± SD of 3 independent experiments. *P<0.05, **P<0.01 vs. the anti-MIRCon group with the control siRNA. #P<0.05, ##P<0.01 vs. the anti-MIR30D cotransduced with the control siRNA via one-way ANOVA followed by the Holm-Sidak test.
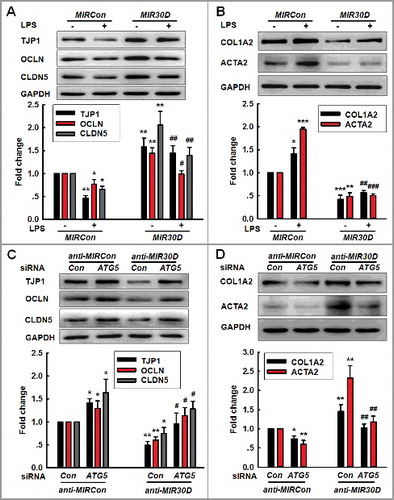
Figure 5. circHECW2 sponges MIR30D. (A) circHECW2 contained one site complementary to MIR30D. The potential complementary residues are presented in red, as determined using the bioinformatic program RNAhybrid. (B) Divergent primers amplified circHECW2 in cDNA but not genomic DNA (gDNA). GAPDH, linear control. (C and D) Effects of Meth or LPS on circHECW2 expression in HBMECs. Real-time PCR was performed to measure the circHECW2 expression levels in HBMECs treated with Meth (100 μM) (C) or LPS (10 ng/ml) (D) for 6 h. All data are presented as the mean ± SD of 4 independent experiments. *P<0.05 vs. vehicle control using the Mann-Whitney test. (E) Effect of LPS on circHecw2 expression in the hippocampus of mice. Mice were administered LPS (0.83 mg/kg) once per day for 7 d. n = 6 animals/group. **P<0.01 vs. saline group using the Mann-Whitney test. (F) Application of a biotin-coupled MIR30D mimic to determine whether MIR30D was able to pull down circHECW2. The biotinylated wild-type MIR30D (Bio-MIR30D-WT) or its biotinylated mutant (Bio-MIR30DΔ) was transfected into HEK293T cells. After streptavidin capture, the circHECW2 and GAPDH mRNA levels were quantified via real-time PCR, and the relative immunoprecipitate/input ratios were plotted. All data are presented as the mean ± SD of 3 independent experiments. **P<0.01 vs. the Bio-MIR30D-WT group via one-way ANOVA followed by the Holm-Sidak test. (G) Following the application of a biotin-labeled specific probe, MIR30D was pulled down by circHECW2. The biotinylated circHECW2 (Bio-circHECW2) or circRNA negative control (Bio-Random) was transfected into HEK293T cells. After streptavidin capture, the MIR30D and RNU6-6P microRNA levels were quantified via real-time PCR, and the relative immunoprecipitate/input ratios were plotted. All data are presented as the mean ± SD of 4 independent experiments. **P<0.01 vs. the Bio-Random group via one-way ANOVA followed by the Holm-Sidak test. (H) Double-label in situ hybridization assays showed that circHECW2 colocalized with MIR30D. Scale bar: 10 μm. bp, base pair; M, size markers; Meth, methamphetamine.
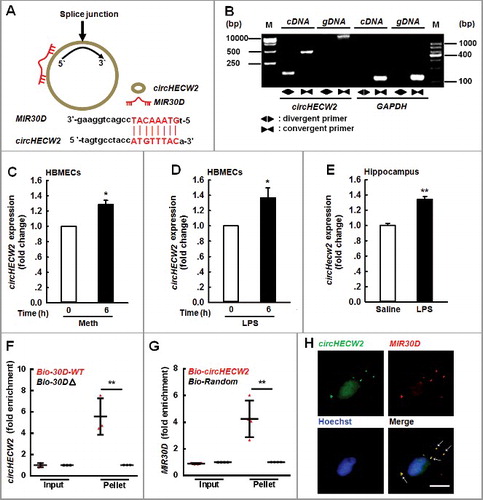
Figure 6. Knockdown of circHECW2 expression inhibits the EndoMT by targeting MIR30D in vitro. (A and B) Transduction of HBMECs with circHECW2 siRNA lentivirus significantly inhibited the LPS-induced decreases in the TJP expression levels (A) and the increases in the mesenchymal cell marker expression (B). HBMECs were transduced with the circHECW2 lentivirus for 24 h and were subsequently incubated with LPS (10 ng/ml) for 24 h. All data are presented as the mean ± SD of 3 independent experiments. *P<0.05, **P<0.01 vs. the circCon siRNA group. #P<0.05, ##P<0.01, ###P<0.001 vs. the LPS-treated circCon siRNA via one-way ANOVA followed by the Holm-Sidak test. (C and D) Transduction of HBMECs with the anti-MIR30D lentivirus significantly inhibited the increases in the TJP expression levels (C) and the decreases in the mesenchymal cell marker expression (D) induced by circHECW2 siRNA. HBMECs were cotransduced with anti-MIR30D and circHECW2 siRNA for 24 h. All data are presented as the mean ± SD of 3 independent experiments. *P<0.05, **P<0.01, ***P<0.001 vs. the circCon siRNA cotransduced with the anti-MIRCon group. #P<0.05, ###P<0.001 vs. the circHECW2 siRNA cotransduced with the anti-MIRCon group via a one-way ANOVA followed by the Holm-Sidak test.
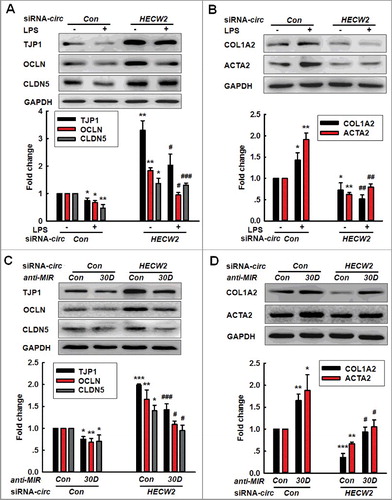
Figure 7. Knockdown of circHecw2 inhibits the EndoMT in vivo. (A) Schematic diagram presents the procedure for microinjection of circHecw2 siRNA lentivirus prior to LPS treatment in mice. (B) Representative images of C57BL/6J mice bilaterally microinjected with siRNA-GFP lentivirus (1 μl of 109 viral genomes μl−1) in the hippocampus. Scale bar: 200 μm. (C) circHecw2 siRNA lentivirus injection successfully decreased circHecw2 expression. Two wk after the microinjection, mice were sacrificed and assessed regarding the circHecw2 level as determined via real-time PCR. n = 6 animals/group. *P<0.05 vs. circCon using the Mann-Whitney test. (D to G) Microinjection of C57BL/6J mice with circHecw2 siRNA lentivirus significantly inhibited the LPS-induced decreases in the TJP expression levels (D and E) and the increases in the mesenchymal cell marker expression (F and G). Mice were microinjected with the circHecw2 siRNA or circCon siRNA lentivirus for 2 wk and were subsequently treated with LPS (0.83 mg/kg) once per day for 7 d. n = 6 animals/group. *P<0.05, **P<0.01, ***P<0.001 vs. the saline-treated circCon siRNA group. #P<0.05, ##P<0.01,###P<0.001 vs. the LPS-treated circCon siRNA group via one-way ANOVA followed by the Holm-Sidak test.
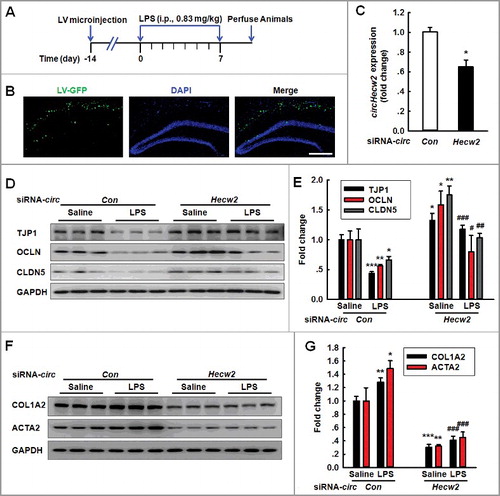
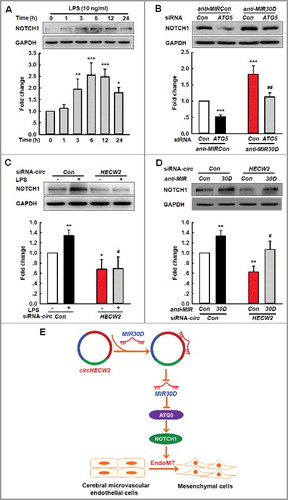
Figure 8. Involvement of the NOTCH1 pathway in the circHECW2-MIR30D-ATG5-mediated EndoMT. (A) LPS induced an increased cleavage of NOTCH1/NICD from NOTCH1. Cells were treated with LPS (10 ng/ml) for different time points. All data are presented as the mean ± SD of 3 independent experiments. *P<0.05, **P<0.01, ***P<0.001 vs. the vehicle control via one-way ANOVA. (B) Transduction of HBMECs with ATG5 siRNA significantly inhibited the increases in the NOTCH1 level induced by anti-MIR30D lentivirus. HBMECs were cotransduced with anti-MIR30D and ATG5 siRNA for 24 h. All data are presented as the mean ± SD of 3 independent experiments. ***P<0.001 vs. the anti-MIRCon cotransduced with the control siRNA group. ##P<0.01 vs. the anti-MIR30D cotransduced with the ATG5 siRNA via one-way ANOVA followed by the Holm-Sidak test. (C) Transduction of HBMECs with circHECW2 siRNA lentivirus significantly inhibited the level of NOTCH1 induced by LPS. HBMECs were transduced with the circHECW2 siRNA or circCon siRNA for 24 h and were subsequently incubated with LPS (10 ng/ml). All data are presented as the mean ± SD of 3 independent experiments. *P<0.05, **P<0.01 vs. the circCon siRNA group via one-way ANOVA. #P<0.05 vs. the LPS-treated circCon siRNA group via one-way ANOVA followed by the Holm-Sidak test. (D) Transduction of HBMECs with the anti-MIR30D lentivirus significantly inhibited the decreases in the NOTCH1 level induced by circHECW2 siRNA. HBMECs were cotransduced with anti-MIR30D and circHECW2 siRNA. All data are presented as the mean ± SD of 3 independent experiments. **P<0.01 vs. the circCon siRNA with anti-MIRCon-cotransduced group. #P<0.05 vs. the circHECW2 siRNA with anti-MIRCon-cotransduced group via one-way ANOVA followed by the Holm-Sidak test. (E) circHECW2, identified as ceRNA, functioned as an endogenous MIR30D sponge to sequester MIR30D and inhibited its activity, which resulted in increased ATG5 expression and consequent EndoMT via the NOTCH1 signaling pathway.