Figures & data
Figure 1. Selectively impaired secretion of TGFB1 in ILK-depleted murine fibroblasts. Primary control or Ilk cKO murine fibroblasts were grown for 24 h on fibronectin-coated (10 μg/ml) tissue culture dishes in the absence of serum. Total activatable TGFB1 was determined by ELISA in supernatants (A) and cell lysates (B). Ilk cKO cells released significantly less (*P = 0.0324) TGFB1 into the media than parallel control cultures, but retained significantly higher amounts of TGFB1 intracellularly (**P = 0.0038). Each symbol represents one independently derived fibroblast strain; lines represent mean. Supernatants were further used to determine levels of IL6 (C) and CCL2 (D) by Cytometric Bead Assay. Unlike TGFB1, these fibroblast products were secreted at comparable amounts by control and Ilk cKO fibroblasts. ns: no significant difference. Data are presented as mean ± SD. Three independent experiments, n = 3, each sample was measured 3 times.
Figure 2. Intracellular accumulation of TGFB1 large latent complex in Ilk cKO murine fibroblasts. (A) Control and Ilk cKO primary murine fibroblasts were grown for 4 or 7 d in the absence of serum. Ilk ablation abolished formation of FBN1 (fibrillin 1) and LTBP1 fibers and networks (red) in the extracellular space. Nuclei were stained with DAPI (blue). Scale bars: 50 μm. (B) Levels of LTBP1 (not bound to the TGFB1 SLC and not anchored to ECM) secreted into the supernatant (SN) were comparable in control and Ilk cKO fibroblasts. By contrast, cell lysates (CL) showed an increased presence of shifted signals representing LTBP1 molecules that are disulfide-linked to the TGFB1 prodomain LAP. This complex is indicated as LLC. Levels of FBN1 in supernatants (SN) and cell lysates (CL) were not affected by absence of ILK. (C) Immunoblotting for the TGFB1 prodomain (LAP) confirmed increased intracellular presence (CL) of TGFB1 linked to LTBP1 in Ilk cKO fibroblasts cultured for 2 d. Upon reduction (+SH), the LAP signal shifted down to its monomeric position. Membranes stained by Ponceau indicate comparable loading. (D) Control and Ilk cKO primary murine fibroblasts were transfected with the double-tagged LAP-TGFB1 construct (shown in Figure S2A). After 24 h, HA-LAP-TGFB1 localization was visualized by detection of the tags. First, nonpermeabilized cells were incubated with an antibody specific for the HA-tag to detect secreted HA-LAP-TGFB1 (green). Cells were then permeabilized and incubated with an anti-FLAG antibody to visualize total HA-LAP-TGFB1-FLAG. Abundant intracellularly located, but hardly any extracellular LAP-TGFB1 was detected in Ilk cKO fibroblasts. Scale bar: 10 μm.
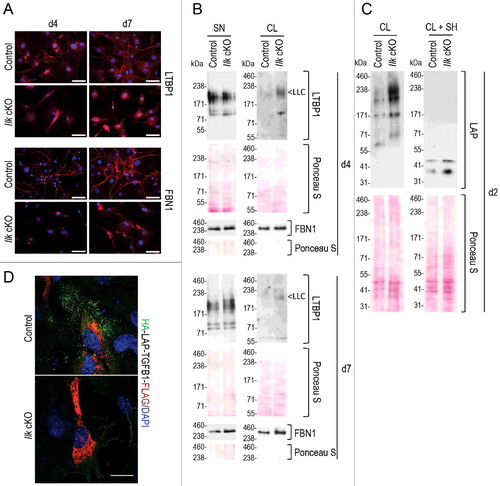
Figure 3. ARHGAP26 is a RhoGAP that controls TGFB1 secretion by interacting with ILK and both contribute to autophagy. (A) Domain structure of wild-type ARHGAP26 protein (top) and the mutant lacking the SH3 domain (bottom). Red box indicates the N-terminally fused FLAG-tag. BAR, Bin-Amphiphysin-Rvs domain; PH, Pleckstrin homology domain; RhoGAP, RhoGTPase activating domain; SH3, Src homology 3 domain. (B) Human Wi26 fibroblasts were cotransfected with murine HA-Parva (to stabilize ILK [Citation54]) and either wild-type murine FLAG-Arhgap26 or with the mutant lacking the C-terminal SH3 domain (FLAG- Arhgap26 [ΔSH3]). Endogenous ILK was immunoprecipitated, and coimmunoprecipitated PARVA and ARHGAP26 were detected by immunoblotting. The interaction of endogenous ILK with PARVA was used as positive control. Wild-type, but not the mutant ARHGAP26 protein coimmunoprecipitated with ILK. IP, immunoprecipitation; IB, immunoblot; IP neg (IgG), isotype control. (C) In the reciprocal experiment, Wi26 cells were transfected with either wild-type FLAG-Arhgap26 or with the mutant lacking the C-terminal SH3 domain (ΔSH3). ARHGAP26 was immunoprecipitated and ILK coimmunoprecipitated by wild-type, but not the mutant ARHGAP26, confirming the interaction of ILK with ARHGAP26's SH3 domain. (D) RhoGAP assay with recombinant ARHGAP26 and ILK. The hydrolysis of GTP by RHOA and the influence of ARHGAP26 were determined in samples with RHOA or ARHGAP26 alone as controls, with a combination of both and in a sample containing both and added ILK. The basal GAP activity of ARHGAP26 (ARHGAP26 + RHOA) was significantly elevated by the presence of ILK (***P<0.0001). (E) siRNA-mediated silencing of ARHGAP26 (si-ARHGAP26) in Wi26 fibroblasts resulted in significantly reduced TGFB1 amounts released into the medium (**P = 0.0066) compared to controls transfected with scrambled siRNA (si-Scr). Efficient silencing of ARHGAP26 is illustrated in the blot below panel (E). (F) Expression of the ARHGAP26 mutant lacking the C-terminal SH3 domain (ΔSH3) had no influence on TGFB1 release (Mann Whitney U-test: P = 0.9293). Lines indicate means; each symbol represents an individual fibroblast strain; n = 3 experiments. The immunoblot in F illustrates comparable transfection efficiency and expression level of the 2 ARHGAP26 proteins. Untransfected Wi26 fibroblasts (untr.) were used as negative control. (G to I) Autophagy was analyzed in murine (G) and human fibroblasts (H and I) following treatment of cells either with DMSO, or with 20 μg/ml rapamycin or with 100 nM BafA for 4 h. The upper and lower ‘>’ symbols in the immunoblots indicate the position of the MAP1LC3B-I and -II variants, respectively. Autophagy was visualized by presence of MAP1LC3-II bands and actin (ACTB) was used as loading control. Ablation of Ilk in murine fibroblasts (Ilk cKO in G) or siRNA-mediated silencing of ILK (H) or of ARHGAP26 (I) in human Wi26 fibroblasts all resulted in attenuated autophagy. In particular, depletion of ARHGAP26 strongly impaired stimulated (rapamycin) as well as basal autophagy (DMSO), while ILK depletion induced less strong effects, but also affected autophagy maturation (BafA). Signal intensity was quantified densitometrically and the ratio of MAP1LC3-II to ACTB is presented below the blots. Data are representative of 3 (G and I) and 5 experiments (H).
![Figure 3. ARHGAP26 is a RhoGAP that controls TGFB1 secretion by interacting with ILK and both contribute to autophagy. (A) Domain structure of wild-type ARHGAP26 protein (top) and the mutant lacking the SH3 domain (bottom). Red box indicates the N-terminally fused FLAG-tag. BAR, Bin-Amphiphysin-Rvs domain; PH, Pleckstrin homology domain; RhoGAP, RhoGTPase activating domain; SH3, Src homology 3 domain. (B) Human Wi26 fibroblasts were cotransfected with murine HA-Parva (to stabilize ILK [Citation54]) and either wild-type murine FLAG-Arhgap26 or with the mutant lacking the C-terminal SH3 domain (FLAG- Arhgap26 [ΔSH3]). Endogenous ILK was immunoprecipitated, and coimmunoprecipitated PARVA and ARHGAP26 were detected by immunoblotting. The interaction of endogenous ILK with PARVA was used as positive control. Wild-type, but not the mutant ARHGAP26 protein coimmunoprecipitated with ILK. IP, immunoprecipitation; IB, immunoblot; IP neg (IgG), isotype control. (C) In the reciprocal experiment, Wi26 cells were transfected with either wild-type FLAG-Arhgap26 or with the mutant lacking the C-terminal SH3 domain (ΔSH3). ARHGAP26 was immunoprecipitated and ILK coimmunoprecipitated by wild-type, but not the mutant ARHGAP26, confirming the interaction of ILK with ARHGAP26's SH3 domain. (D) RhoGAP assay with recombinant ARHGAP26 and ILK. The hydrolysis of GTP by RHOA and the influence of ARHGAP26 were determined in samples with RHOA or ARHGAP26 alone as controls, with a combination of both and in a sample containing both and added ILK. The basal GAP activity of ARHGAP26 (ARHGAP26 + RHOA) was significantly elevated by the presence of ILK (***P<0.0001). (E) siRNA-mediated silencing of ARHGAP26 (si-ARHGAP26) in Wi26 fibroblasts resulted in significantly reduced TGFB1 amounts released into the medium (**P = 0.0066) compared to controls transfected with scrambled siRNA (si-Scr). Efficient silencing of ARHGAP26 is illustrated in the blot below panel (E). (F) Expression of the ARHGAP26 mutant lacking the C-terminal SH3 domain (ΔSH3) had no influence on TGFB1 release (Mann Whitney U-test: P = 0.9293). Lines indicate means; each symbol represents an individual fibroblast strain; n = 3 experiments. The immunoblot in F illustrates comparable transfection efficiency and expression level of the 2 ARHGAP26 proteins. Untransfected Wi26 fibroblasts (untr.) were used as negative control. (G to I) Autophagy was analyzed in murine (G) and human fibroblasts (H and I) following treatment of cells either with DMSO, or with 20 μg/ml rapamycin or with 100 nM BafA for 4 h. The upper and lower ‘>’ symbols in the immunoblots indicate the position of the MAP1LC3B-I and -II variants, respectively. Autophagy was visualized by presence of MAP1LC3-II bands and actin (ACTB) was used as loading control. Ablation of Ilk in murine fibroblasts (Ilk cKO in G) or siRNA-mediated silencing of ILK (H) or of ARHGAP26 (I) in human Wi26 fibroblasts all resulted in attenuated autophagy. In particular, depletion of ARHGAP26 strongly impaired stimulated (rapamycin) as well as basal autophagy (DMSO), while ILK depletion induced less strong effects, but also affected autophagy maturation (BafA). Signal intensity was quantified densitometrically and the ratio of MAP1LC3-II to ACTB is presented below the blots. Data are representative of 3 (G and I) and 5 experiments (H).](/cms/asset/fa44eead-79df-48b3-8bd7-5591044a759f/kaup_a_1422850_f0003_oc.jpg)
Figure 4. Secretion of latent TGFB1 requires autophagosomal intermediates. (A) Schematic representation of the tagged human LAP-TGFB1 constructs used. (B) Immunofluorescence analysis of human Wi26 fibroblasts that were transfected with the double-tagged construct illustrated in (A) and stained for endogenous MAP1LC3 (using MAP1LC3B antibody, magenta). Both, the prodomain (LAP, green) and the growth factor TGFB1 (red) colocalized with the autophagosomal marker MAP1LC3 (white in merged image). Boxes represent areas shown at higher magnification in insets. Scale bar: 10 μm. (C) The images of 25 cells were used to determine Pearson correlation coefficient, which reflects the extent of colocalization (LAP and MAP1LC3B) used here to indicate the presence of TGFB1 in autophagosomal structures. Values of about 0.2 confirmed selective colocalization under basal conditions. (D) Quantification revealed that about 40% of MAP1LC3-positive autophagosomes were also positive for HA-LAP. (E) Immunoelectron microscopy analysis of human Wi26 fibroblasts that were transfected with the HA-tagged construct illustrated in (A). Colocalization of HA-LAP (marked by small gold particles) and the autophagosomal marker MAP1LC3 (large gold particles) in double-membrane autophagosomes is illustrated in 4 examples. Scale bar: 100 nm.
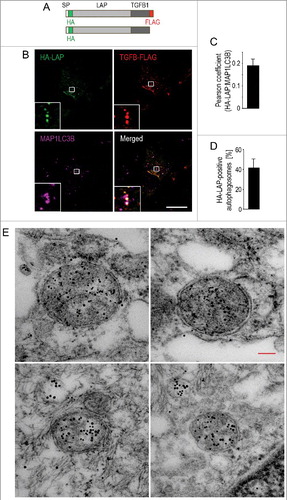
Figure 5. Secretion of latent TGFB1 requires the formation of autophagosomal intermediates by ATG5, ATG7 and BECN1. (A) Mouse embryonic fibroblasts (MEFs) derived from atg5 KO or Atg5 WT control animals were treated either with DMSO, or with 20 μg/ml rapamycin (Rapa) or with 100 nM BafA for 4 h. Immunoblot analysis visualizing the presence of MAP1LC3-II confirmed failure of Atg5-deficient MEFs to execute autophagy. ACTB was used as loading control. Signal intensity was quantified densitometrically and the ratio of MAP1LC3-II to ACTB is presented below the blots. (B) Levels of TGFB1 were assessed by ELISA in supernatants of atg5 KO and control MEFs grown for 24 h in the absence of serum. TGFB1 release into the medium was completely abolished by blocking autophagy (*** P<0.0001). (C) atg5 KO or Atg5 WT MEFs were transfected with the HA-tagged construct illustrated in A and grown for 24 h. The amounts of TGFB1 released to supernatants or retained in cell lysates were determined in 2 independent samples by immunoblotting and staining for LAP (using HA antibody). Ponceau S staining of the membrane was used to confirm equal loading. The upper bands, reflecting the TGFB1 proform, indicate slightly reduced amounts of this form in lysates of atg5 KO cells. By contrast, the secreted TGFB1 proform is present in control supernatants (lower bands) but absent in supernatants of atg5 KO cells. (D) For rescue experiments, atg5 KO MEFs were transfected with V5-tagged constructs of either ATG5 or ATG7 or left untransfected. Immunoblotting confirmed expression of both ATGs in transfected cells. (E) Levels of TGFB1 were assessed by ELISA in supernatants of the transfected atg5 KO MEFs (shown in D) grown for 24 h in the absence of serum. Exogenous ATG5 partially rescued TGFB1 release into the medium, while exogenous ATG7 did not. (F to H) Levels of TGFB1 were analyzed in human Wi26 fibroblasts following treatment with the autophagy inhibitor 3-MA (F), or after siRNA-mediated silencing of ATG5 (G), of ATG7 or of BECN1 (H). All autophagy-inhibiting treatments significantly impaired TGFB1 release. Lines in (B, E, F, G and H) indicate means; each symbol represents an individual fibroblast strain; n = 3 experiments.
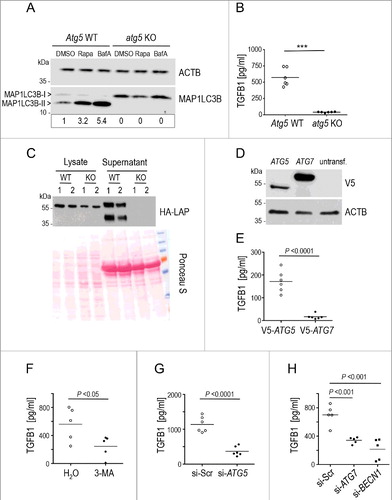
Figure 6. Attenuation of autophagy impairs secretion of TGFB1 in human and murine macrophages. (A) Autophagy was analyzed in human THP-1-derived macrophages following treatment either with DMSO, or with 20 μg/ml rapamycin (Rapa) for 4 h. Autophagy was visualized by the presence of MAP1LC3-II bands in immunoblots. Inhibition of PtdIns3K by 3-MA (3-MA) strongly attenuated stimulated autophagy. (B and C) TGFB1 secretion was determined by ELISA in supernatants from human THP-1 macrophages (B) or from primary murine peritoneal macrophages (C) after treatment with 3-MA to inhibit the PtdIns3K complex or with water as control. Treatment with 3-MA resulted in significantly reduced TGFB1 levels in supernatants of both, human and murine macrophages (Mann Whitney U-test used in C). (D) Immunoblot illustrating efficient siRNA-mediated knockdown of ATG7 in THP-1 macrophages in comparison to control (si-Scr). ACTB levels were used to indicate comparable loading. (E) TGFB1 secretion was analyzed in supernatants of human THP-1 cells transfected either with siRNA specific for ATG7 or scrambled control. ATG7 depletion resulted in prominently attenuated TGFB1 release. (F) Autophagy was analyzed in THP-1 macrophages by treatment either with DMSO, or with 100 nM BafA, or with 20 μg/ml rapamycin (Rapa) for 4 h. The upper and lower ‘<’ symbols in the immunoblots indicate the position of the MAP1LC3B-I and -II variants, respectively. Autophagy was visualized by the presence of MAP1LC3-II and SQSTM1 bands in immunoblots. Depletion of ATG7 by siRNA clearly impaired basal and stimulated autophagy. Data are representative of 3 experiments. Signal intensity in (A) and (F) were quantified densitometrically; the ratio of MAP1LC3-II to ACTB is presented below the blots.
Figure 7. GORASP2 interacts with TGFB1 and MAP1LC3 and its depletion impairs autophagy and TGFB1 secretion in human fibroblasts. (A) Immunoblot illustrating efficient siRNA-mediated knockdown of GORASP2 in comparison to control in Wi26 fibroblasts. ACTB levels were used to indicate comparable loading. (B) Autophagy was analyzed after treatment of cells either with DMSO, or with 100 nM BafA, or with 20 μg/ml rapamycin (Rapa) for 4 h. The upper and lower ‘<’ symbols in the immunoblots indicate the position of the MAP1LC3B-I and -II variants, respectively. Autophagy was visualized by the presence of MAP1LC3-II and SQSTM1 bands in immunoblots. siRNA-mediated silencing of GORASP2 resulted in a moderate decrease of basal autophagy (DMSO), but prominent attenuation of autophagy after stimulation (Rapa). Data are representative of 3 experiments. Signal intensity was quantified densitometrically and the ratio of MAP1LC3-II to ACTB is presented below the blots. (C) Immunofluorescence micrographs of human Wi26 fibroblasts, expressing HA-LAP-TGFB1 (illustrated in A, green), GORASP2-MYC (red) and endogenous MAP1LC3B (cyan). All 3 proteins colocalized at distinct structures (white in insets). Nuclei were stained with DAPI (blue). Scale bar: 10 μm. (D) Coimmunoprecipitation of HA-LAP-TGFB1 with GORASP2-MYC and the autophagosomal marker MAP1LC3-II (stained by MAP1LC3B antibody) confirmed the close association of the 2 proteins in autophagosomal intermediates. Asterisks in the GORASP2-MYC blot indicate signals obtained with the HA antibody used to probe the same membrane without stripping. (E) In a reciprocal approach, GORASP2-MYC and endogenous MAP1LC3-II were coimmunoprecipitated by HA-LAP-TGFB1. (F-H) siRNA-mediated silencing of GORASP2 (si-GORASP2) in Wi26 fibroblasts resulted in significantly reduced TGFB1 amounts released into the medium (***P = 0.0001) compared to controls transfected with scrambled siRNA (si-Scr) (F), but unchanged amounts of IL6 (G) or CCL2 (H).
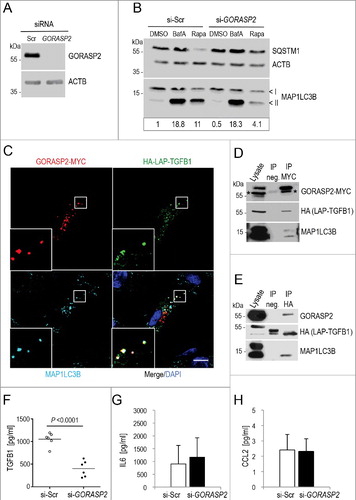
Figure 8. Fibroblast secretion of latent TGFB1 requires its interaction with GORASP2 and mammalian Atg8-family proteins. (A) Schematic presentation of GORASP2 fragments used in affinity precipitation assays. PDZ1, N-terminal domain; PDZ2, central domain; SPR, serine/proline-rich. (B to E) Representative results of affinity isolation assays and a co-immunoprecipitation to evaluate the interaction of GORASP2 with MAP1LC3 proteins. (B) Expression of all GORASP2-GST fusion proteins was verified by immunoblotting: control (GST), full-length GORASP2, PDZ1 domain (PDZ1), PDZ2 domain (PDZ2) and SPR region (SPR) (top). To identify which region of GORASP2 interacts with MAP1LC3, GST affinity isolation assays were performed using 20 μg of GORASP2-GST fusion proteins, incubated with lysates of MYC-MAP1LC3A transfected Wi26 fibroblasts. One microgram of lysate was loaded as input control (Lys). MAP1LC3A interacted strongly with full-length GORASP2 and with the PDZ2 domain alone, but not with the PDZ1 domain or the SPR region. (C) Wi26 fibroblasts treated either with rapamycin (20 μg/ml) and BafA (100 nM) or with DMSO (as control) were used to co-immunoprecipitate endogenous GORASP2 and MAP1LC3B. MAP1LC3B interacted with GORASP2 independent of its lipidation state. Arrows indicate the position of bands representing GORASP2, located just above the IgG heavy chains. (D) A comparable affinity isolation assay was performed with the related mammalian Atg8-family proteins MAP1LC3B and GABARAPL2, showing that all 3 interacted with GORASP2 (GO2). (E) To evaluate a potential interaction of MAP1LC3 with the LIR motif found in GORASP2 and its specificity for GORASP2, we performed affinity isolation assays using GST fusion proteins with wild-type GORASP2 (GST-GORASP2 WT), with GORASP2 containing an inactive LIR motif mutant (GST-GORASP2Y196A), wild-type GORASP1 (GST-GORASP1 WT) and GST as control. The LIR motif is essential for the interaction with GORASP2, however, a weak interaction was also found with GORASP1. (F) GORASP2 WT-MYC and GORASP2Y196A-MYC transfected Wi26 fibroblasts were used to confirm the essential role of the LIR motif for MAP1LC3 binding to GORASP2. GORASP2 with mutated LIR motif localized exclusively at the Golgi, and in contrast to the wild-type protein showed no colocalization with MAP1LC3. (G) The images of 41 wild-type and 44 cells expressing mutated GORASP2Y196A were used to determine Pearson correlation coefficient, which reflects the extent of colocalization (GORASP2 and MAP1LC3) used here to indicate the presence of GORASP2 at autophagosomal structures. Values of about 0.25 confirmed the requirement of an intact LIR motif for selective colocalization. (H) GORASP2 WT-MYC (WT) and GORASP2Y196A-MYC (YA) transfected Wi26 fibroblasts were used to detect HA-LAP in cell lysates (CL) and supernatants (SN). Cells expressing the GORASP2 LIR mutant Y196A displayed intracellular retention of and impaired secretion of HA-LAP-TGFB (left panel). The transfection efficiency of both GORASP2 variants was comparable (right panel).
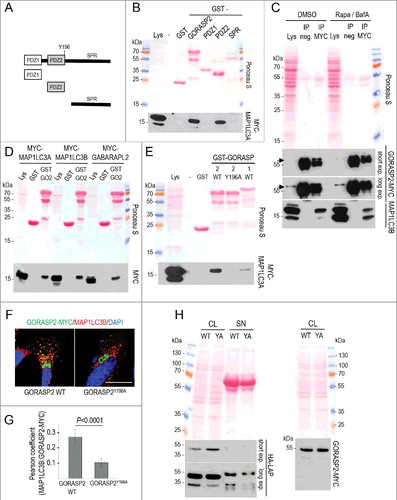
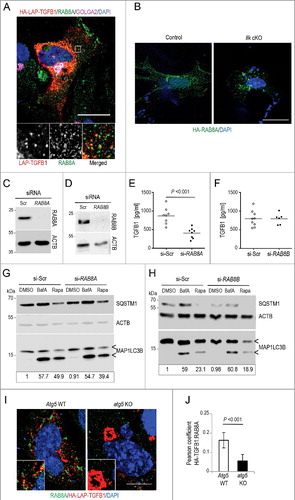
Figure 9. Transport of latent TGFB1 to the cell surface requires RAB8A-mediated secretion. (A) Immunofluorescence analysis of human Wi26 fibroblasts expressing HA-LAP-TGFB1 (red), stained for endogenous RAB8A (green) and GOLGA2 (magenta) identified colocalization of HA-LAP with RAB8A at Golgi-derived autophagosomal intermediates (yellow in merged inset). Scale bar: 10 μm. (B) Immunofluorescence analysis of murine control and Ilk cKO fibroblasts, transfected with HA-tagged RAB8A (green; DAPI-stained nuclei appear blue) showed relocalization of RAB8A to perinuclear aggregates. Scale bar: 10 μm. (C and D) Immunoblots illustrating knockdown efficiency of RAB8A (C) and RAB8B (D) in comparison to control (si-Scr). ACTB levels were used to indicate comparable loading. (E and F) Secreted TGFB1 levels were significantly reduced upon knockdown of RAB8A (P<0.001) (E); whereas no change in TGFB1 secretion was detected upon knockdown of RAB8B (F). Each symbol represents one independent transfectant. (G and H) Autophagy was analyzed in human Wi26 fibroblasts following treatment either with DMSO, or with 100 nM BafA, or with 20 μg/ml rapamycin (Rapa) for 4 h. The upper and lower ‘<’ symbols in the immunoblots indicate the position of the MAP1LC3B-I and -II variants, respectively. Autophagy was visualized by the presence of MAP1LC3-II and SQSTM1 bands in immunoblots. Depletion of RAB8A (G) and of RAB8B (H) did not affect basal or stimulated autophagy. Data are representative of 3 experiments. Signal intensities were quantified densitometrically and the ratio of MAP1LC3-II to ACTB is presented below the blots. (I) Immunofluorescence analysis of MEFs derived from atg5 KO or Atg5 WT animals expressing HA-LAP-TGFB1 (red) and stained for endogenous RAB8A (green) identified partial colocalization of HA-LAP with RAB8A at Golgi-derived autophagosomal intermediates (yellow in merged inset), which is not observed in atg5 KO cells. Scale bar: 5 μm. (J) The images of 20 Atg5 WT and 26 atg5 KO cells were used to determine the Pearson correlation coefficient, which reflects the extent of colocalization of TGFB1 with RAB8A (LAP and RAB8A). Values of about 0.15 confirmed selective colocalization.