Figures & data
Figure 1. Interaction of Arabidopsis ATI3 and ATG8 proteins in yeast cells. The activation domain (AD) fusions of ATI3 genes were cotransformed with the empty Gal4 DNA binding domain vector (pBD) and fusions of ATG8 genes into yeast cells and grown in the absence of leucine, tryptophan and histidine (A). Proteins were isolated from the yeast cells and assayed for β-galactosidase activity using o-nitrophenyl-β-d-galactopyranose (ONPG) as substrate (B). Data represent means and standard errors (n = 5).

Figure 2. Protein sequences and motifs of Arabidopsis ATI3A, ATI3B and ATI3C. Sequence comparisons are between ATI3A and ATI3B (A) and between ATI3A and ATI3C (B). Amino acid residues identical between the 2 compared proteins are in black background and the conserved W and L residues in the putative WxxL LIR motifs at their C termini are indicated with asterisks.
Figure 3. BiFC analysis of ATI3A interaction with ATG8A in planta. Fluorescence was observed in the transformed N. benthamiana leaf epidermal cells from complementation of the N-terminal half of YFP fused with ATG8A (ATG8A-N-YFP) by the C-terminal half of YFP fused with ATI3A (ATI3A-C-YFP). No fluorescence was observed when ATG8A-N-YFP was co-expressed with unfused C-YFP or with ATI3AW260A-C-YFP, or when unfused N-YFP was co-expressed with ATI3A-C-YFP. YFP epifluorescence, bright-field and emerged images of the same cells are shown. Bar: 20 μm.
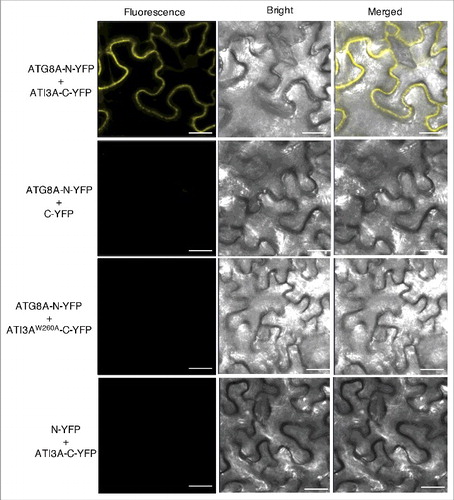
Figure 4. Heat-induced punctate structures of ATI3-ATG8 complexes. Agrobacterium cells containing the complementing ATG8A-N-YFP and ATI3A-C-YFP BiFC constructs were infiltrated into N. benthamiana leaves for co-expression. One d after the infiltration, tobacco plants were treated at 42°C for 3 h and complemented BiFC signals were observed by confocal fluorescence microscopy. Increased punctate structures of complemented ATG8A-N-YFP-ATI3A-C-YFP BIFC signals were observed after treatment at 42°C. No BiFC signals were observed from co-expression of ATG8A-N-YFP and ATI3AW260A-C-YFP at either 24°C or 42°C. Bar: 20 μm.
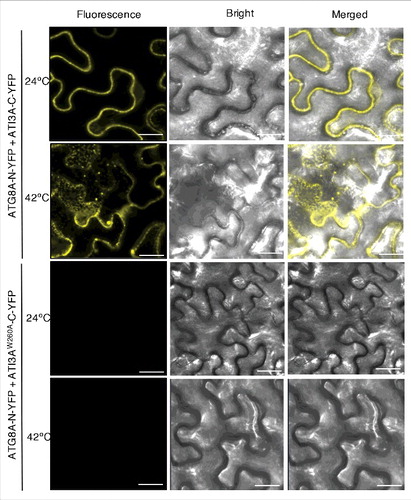
Figure 5. Functional analysis of ATI3 genes in heat tolerance. Two-wk-old seedlings of Col-0 WT, ati3 single, double and triple mutants and ati3a mutant complemented with WT ATI3A and the mutant gene encoding ATI3AW260A were placed in a 45°C growth chamber for 10 h. The heat-treated plants were then moved to a 22°C growth chamber for recovery. The picture was taken after 3 d of recovery at 22°C (A). The survival rates were determined after 5 d of recovery at 22°C following heat treatment at 45°C for 10 h (B). Data represent means and standard errors calculated from 5 replicates (each with approximately 100 seedlings for each genotype). According to Duncan's multiple range test (P = 0.05), means of survival rates do not differ significantly if they are indicated with the same letter.
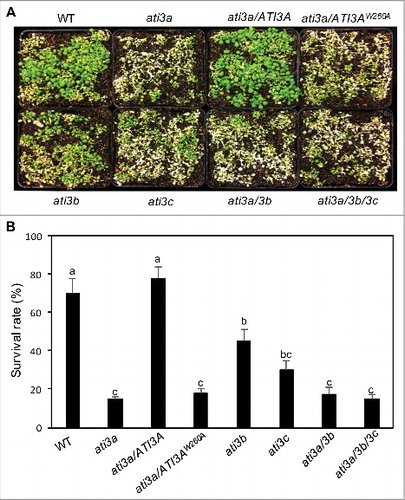
Figure 6. Functional analysis of ATI3 genes in plant resistance to B. cinerea. Six-wk-old Col-0 WT, ati3 single, double and triple mutants and ati3a mutant complemented with WT ATI3A and the mutant gene encoding ATI3AW260A were inoculated by spraying spore suspension at a density of 2.5 × 10⁵ spores/mL and kept at high humidity. Photographs of representative plants were taken 4 d after inoculation (A). Total RNA was isolated from the plants 4 d after inoculation and the transcript levels of the B. cinerea actA gene were determined using qRT-PCR with the Arabidopsis AT3G18780/ACT2 gene as an internal control (B). Data represent means and standard errors (n = 5). According to Duncan's multiple range test (P = 0.05), means of B. cinerea actA gene transcript levels do not differ significantly if they are indicated with the same letter.
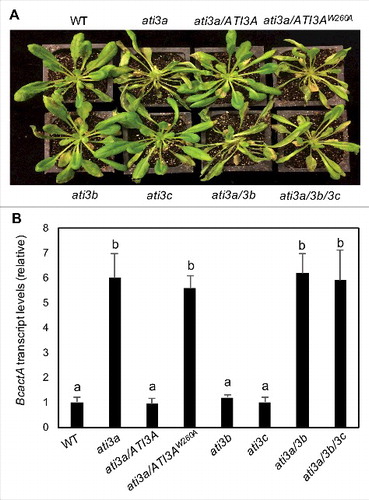
Figure 7. Protein sequences and structures of UBAC2. The amino acid sequence of UBAC2A was compared with that of UBAC2B (A). Amino acid residues identical between the 2 compared proteins are in black background. The transmembrane helices and orientation in the UBAC2A protein were predicted using the TMHMM method based on a hidden Markov model (http://www.cbs.dtu.dk/services/TMHMM-2.0/) (B). A ubiquitin-association domain (UBA) at the C-terminal region of UBAC2A is also indicated. The size of the protein is indicated by the number of amino acid residues shown at the bottom.
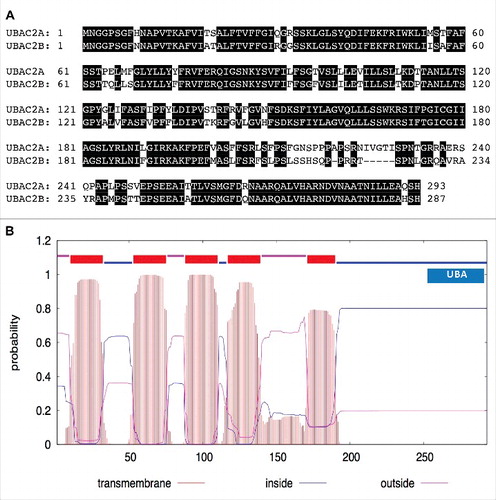
Figure 8. BiFC analysis of ATI3-UBAC2 interactions. BiFC fluorescence was observed in the transformed N. benthamiana leaf epidermal cells from complementation of the N-terminal half of the YFP fused with UBAC2A (UBAC2A-N-YFP) by the C-terminal half of the YFP fused with ATI3A (ATI3A-C-YFP). No fluorescence was observed when UBAC2A-N-YFP was co-expressed with unfused C-YFP or when unfused N-YFP was co-expressed with ATI3A-C-YFP. YFP epifluorescence, bright-field and emerged images of the same cells are shown. BiFC fluorescence from complemented ATG8A-N-YFP and ATI3A-C-YFP is also shown for comparison of punctate fluorescent structures. Bar: 20 μm.
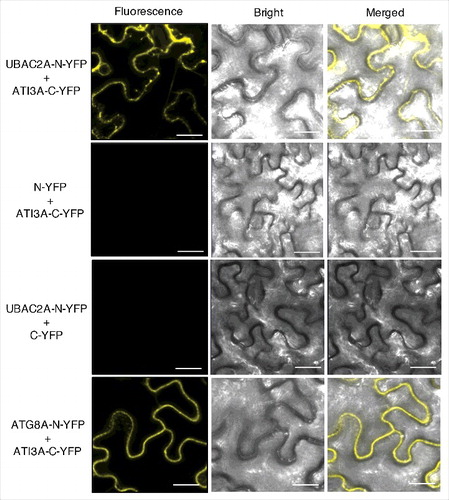
Figure 9. Subcellular localization of UBAC2 proteins. The UBAC2–GFP fusion genes were co-expressed with the BIP-mCherry-KDEL ER marker in N. benthamiana. The GFP, mCherry, bright field, and merged images are shown. Co-expressed BIP-mCherry-KDEL ER marker and UBAC2-GFP generated networks of fluorescent signals with blobs typical of ER structures throughout the cells and the BIP-mCherry-KDEL signals extensively overlapped those of UBAC2-GFP signals. Bar: 10 µm.
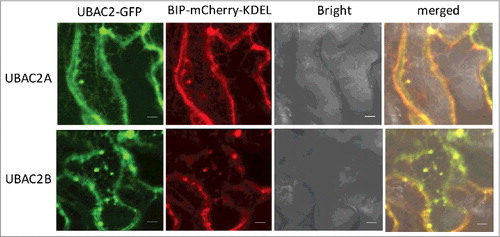
Figure 10. Functional analysis of UBAC2 in heat tolerance. Two-wk-old seedlings of Col-0 WT, ubac2a and ubac2b single and double mutants were placed in a 45°C growth chamber for 10 h. The heat-treated plants were then moved to a 22°C growth chamber for recovery. The picture was taken after 3 d of recovery at 22°C (A). The survival rates were determined after 5 d of recovery at 22°C following heat treatment at 45°C for 10 h (B). Data represent means and standard errors calculated from 5 replicates (each with approximately 100 seedlings for each genotype). According to Duncan's multiple range test (P = 0.05), means of survival rates do not differ significantly if they are indicated with the same letter.
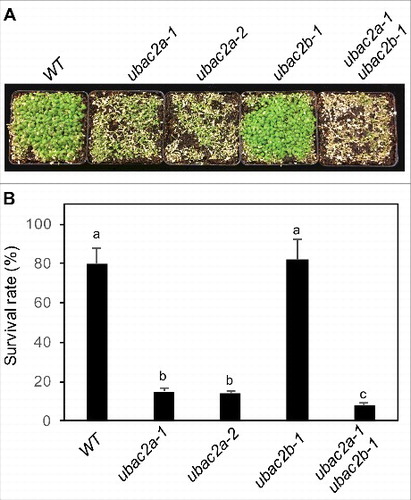
Figure 11. Functional analysis of UBAC2 genes in plant resistance to B. cinerea. Six-wk-old Col-0 wild-type (WT), ubac2a and ubac2b single and double mutants were inoculated by spraying spore suspension at a density of 2.5 × 10⁵ spores/mL and kept at high humidity. Photographs of representative plants were taken 4 d after inoculation (A). Total RNA was isolated from the plants 4 d after inoculation and the transcript levels of the B. cinerea actA gene were determined using qRT-PCR with the Arabidopsis ACT2 gene as an internal control (B). Data represent means and standard errors (n = 5). According to Duncan's multiple range test (P = 0.05), means of the B. cinerea actA gene transcript levels do not differ significantly if they are indicated with the same letter.
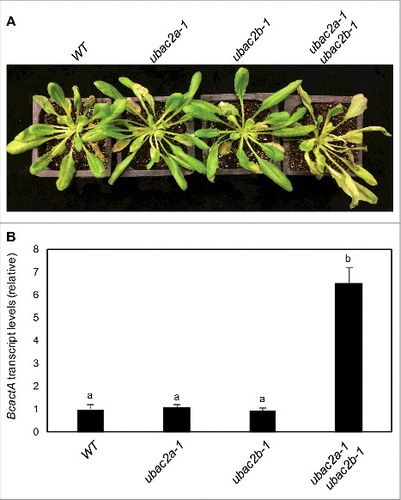
Figure 12. Overexpression of UBAC2 promoted formation of ATI3- and ATG8-labeled punctate structures. BiFC fluorescence was observed in transformed N. benthamiana leaf epidermal cells from complementation of the N-terminal half of the YFP fused with UBAC2A (UBAC2A-N-YFP) by the C-terminal half of the YFP fused with ATI3A (ATI3A-C-YFP) (A). No fluorescence was observed when UBAC2A-N-YFP was co-expressed with unfused C-YFP or when unfused N-YFP was co-expressed with ATI3A-C-YFP (A). YFP epifluorescence images, bright-field images and merged images of the same cells are shown. BiFC fluorescence from complemented ATG8A-N-YFP and ATI3A-C-YFP is also shown for comparison of punctate fluorescent structures. The numbers of formed ATG8A- and ATI3A-labeled puncta per microscopy section were determined in response to heat treatment or overexpression of UBAC2A (B). Data represent means and standard errors calculated from 10 microscopy sections. According to Duncan's multiple range test (P = 0.05), means do not differ significantly if they are indicated with the same letter. Bar: 20 μm.
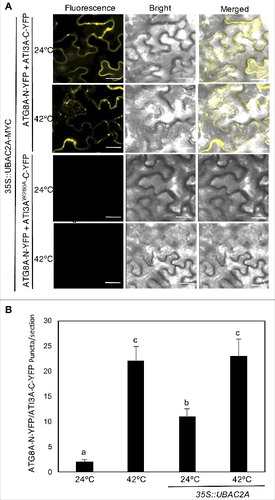
Figure 13. Response of ati3 and ubac2 mutants to ER stress agents. Arabidopsis seeds of WT and mutant seeds were surface sterilized and sown on ½ strength MS media supplemented without (-TM) or with 0.1 mg/L TM (+TM). Pictures were taken 2 wk post germination (A). Seedling surviving rates were determined 2 wk post germination (B). Means and standard errors were calculated from 5 replicates (each with approximately 80 seedlings for each genotype). According to Duncan's multiple range test (P = 0.05), means do not differ significantly if they are indicated with the same letter.
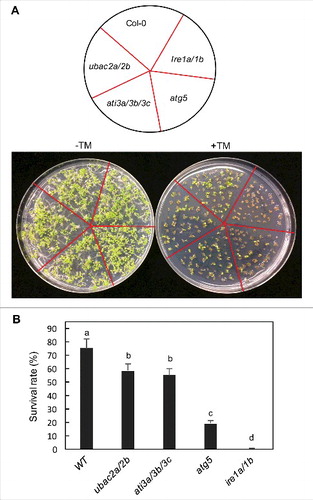
Figure 14. Role of ATI3 and UBAC2 in ER stress-induced autophagy-dependent ER degradation. Leaf protoplasts obtained from 4-wk-old plants were transformed with a BIP-GFP-KDEL construct. The final concentrations of TM and concA used in the experiments were 5 μg/mL and 1 μM, respectively. DMSO was used as a solvent control. Protoplasts were incubated at room temperature in darkness for 12 h, with 40 rpm orbital shaking. Confocal microscopy was used to visualize the GFP fluorescence (A). Bar: 10 μm. The numbers of BIP-GFP-KDEL puncta per leaf protoplast in response to TM-induced ER stress were determined (B). Data represent means and standard errors calculated from 3 replicates (each with about 10 protoplasts for each genotype).
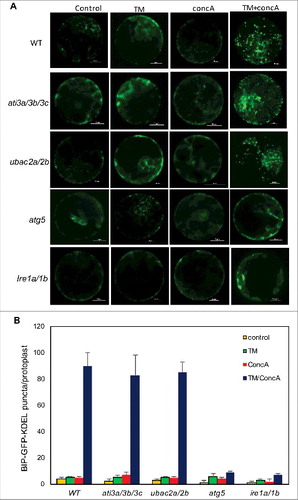
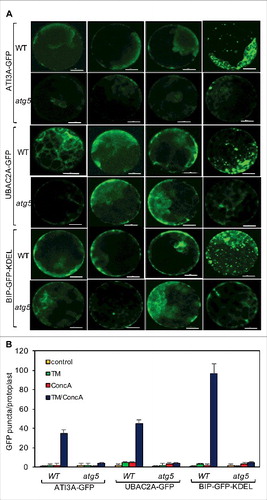
Figure 15. Delivery of ATI3A and UBAC2A into the vacuole under ER stress. Leaf protoplasts obtained from 4-wk-old Col-0 and atg5 plants were transformed with a ATI3A-GFP or UBAC2A-GFP construct. The final concentrations of TM (5 μg/mL) and concA used in the experiments were 5 μg/mL and 1 μM, respectively. DMSO was used as a solvent control for all treatments. Protoplasts were incubated at room temperature in darkness for 12 h, with 40 rpm orbital shaking. Confocal microscopy was used to visualize the GFP fluorescence (A). Bar: 10 μm. The numbers of ATI3A-GFP and UBAC2A-GFP puncta per leaf protoplast in response to TM-induced ER stress were determined (B). Data represent means and standard errors calculated from 3 replicates (each with about 10 protoplasts for each genotype).