
Figures & data
Figure 1. Proteases are naturally selective for either soluble GABARAPL1 (GL1) or GABARAPL1–PE (GL1–PE). (A) Role of ATG4 in the lipidation cycle of LC3. ATG4 primes LC3 by removing the C-terminal tail to reveal the glycine residue necessary for lipidation by ATG7 and ATG3. Later, ATG4 cleaves LC3 from the PE lipid allowing it to be recycled. Conversely, the Legionella effector protease, RavZ, cleaves lipidated LC3 at the peptide bond immediately upstream from the glycine residue, resulting in an LC3 lacking the necessary glycine residue. MmATG4B (1 µM) was incubated with either GABARAPL1-YFP (GL1-YFP) (B) or GABARAPL1-conjugated liposomes (C) for 1 h at 37°C (∼ 7 µM total protein in both experiments). Samples were removed at the noted time points and then subjected to SDS-PAGE. RavZ (1 µM) was also tested against the same substrates (E and F). Gels were then quantified using densitometry and the percent of remaining uncleaved GABARAPL1 substrate was determined (D and G). Inset of (G) further displays RavZ delipidation activity at very low concentrations. Graphs show the average of at least 3 independent proteolysis experiments. Error bars display ± 1 standard deviation. Asterisks denote p-values <0.05 between delipidation and soluble cleavage at each time point as determined by a Student t test.
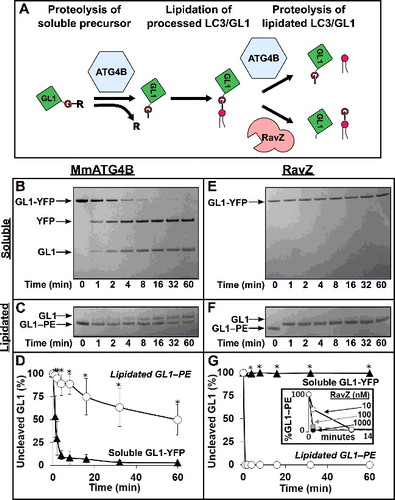
Figure 2. Human ATG4A, ATG4C and ATG4D are predominantly delipidation enzymes. (A) Diagram of the priming and delipidation of human Atg8 homologs by ATG4 isoforms. (B) Lipidated or soluble forms of GABARAPL1 (GL1), GABARAPL2 (GL2), and LC3B were incubated with 150 nM of the indicated ATG4 protease for one h at 37°C. Samples were removed at the noted times and then analyzed by SDS-PAGE. Gels were then quantified using densitometry and the percent of remaining uncleaved substrate was determined. Graphs display the average of 3 independent proteolysis experiments. Error bars display ± 1 standard deviation. Cartoon alignment shows the domains of the 4 human ATG4 proteases including the caspase cleavage site of HsATG4C and HsATG4D. Asterisks denote p-values <0.05 between delipidation and soluble cleavage at each time point as determined by a Student t test.
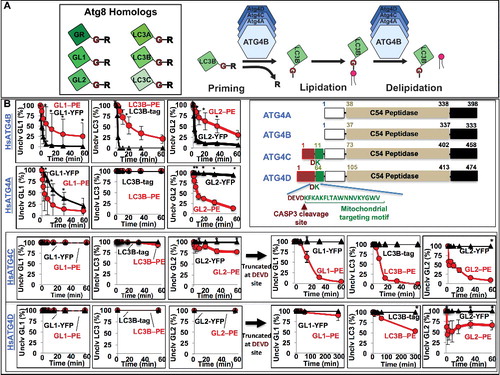
Figure 3. Protease selectivity is driven predominantly by interfacial recognition of intact membranes. RavZ (A) and MmATG4 (B) delipidation of GABARAPL1–PE (GL1–PE) in the presence of the nonionic detergent Triton X-100. Liposomes were incubated with the indicated percent of Triton X-100 for 10 min on ice before the addition of protease (1 µM). Delipidation assays were then conducted as in . Graphs display the average delipidation rate of 3 independent proteolysis experiments. Error bars display ± 1 standard deviation.
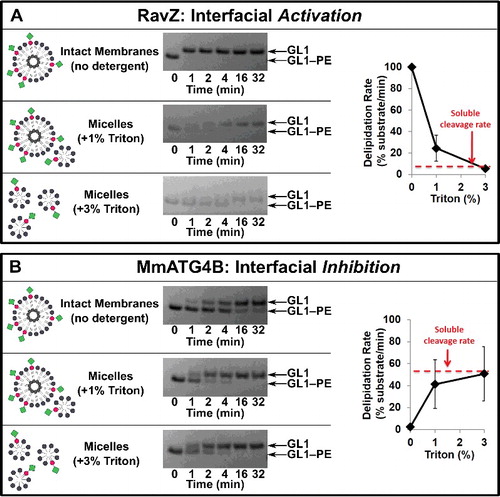
Figure 4. Effect of membrane electrostatics on ATG4 activity. (A) Differences in the LC3-lipid adduct when bound to PE lipid headgroups versus PS headgroups. (B to E) Protease activity against GABARAPL1–PS (GL1–PS). HsATG4A (B), HsATG4B (C), and ATG4C(Δ10aa) (D) cleave GABARAPL1–PS more slowly than GABARAPL1–PE (GL1–PE), whereas RavZ (E) cleaves both very quickly. Inset in (E) uses only 1.5 nM RavZ. (F) Binding of HsATG4A, HsATG4B, HsATG4D and ATG4D(Δ63aa) to liposomes with and without cardiolipin (CL). “10 PtdIns” liposomes were composed of 10 mol percent PtdIns, 55 mol percent DOPE and 35 mol percent POPC. “30 PtdIns” liposomes were composed of 30 mol percent PtdIns, 55 mol percent DOPE, and 15 mol percent POPC. “10 CL” liposomes were composed of 10 mol percent cardiolipin, 10 mol percent PtdIns, 55 mol percent DOPE, 25 mol percent POPC. “20 CL” liposomes contained 20 mol percent cardiolipin, 10 mol percent PtdIns, 55 mol percent DOPE, and 15 mol percent POPC. Liposomes were extruded to a size of 100 nm. Delipidation of GL1 from the liposome compositions in (F) by HsATG4B (G), HsATG4A (H) and ATG4D(Δ63aa) (I). All graphs display the average of 3 independent experiments. Error bars display ± 1 standard deviation.
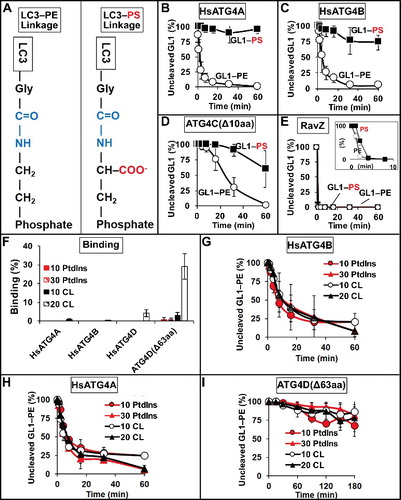
Figure 5. COOH-terminal LIR motif on HsATG4B controls delipidation specificity in vitro. (A) Diagram of LIR mutants used in vitro. (B and C) Activity of LIR mutants in proteolysis assays of LC3 and GABARAPL1 substrates. Insets magnify soluble protease kinetics during the first 10 min. Assays conducted as in . Error bars represent ± 1 standard deviation.
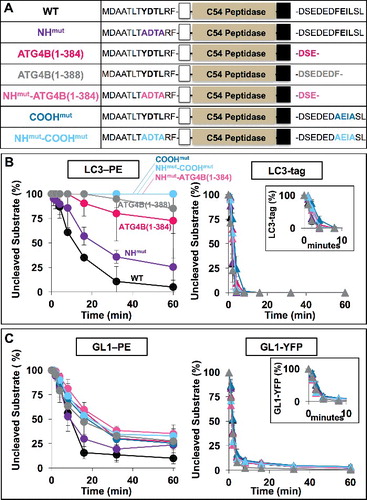
Figure 6. ATG4 QKO shows complete loss of LC3/GABARAP-family priming. (A) Western blot reveals the accumulation of unprimed LC3B and GABARAPL1 (GL1) in ATG4B KO and ATG4 QKO cells. (B) Western blots of individual ATG4 homologs show complete loss of ATG4 at the protein level. (C) Representative anti-LC3B immunofluorescence images show loss of LC3B puncta formation in ATG4B KO and ATG4 QKO cells. N = 47, 50, 83, 85, 65 and 42, respectively. (D) Representative anti-FLAG immunofluorescence images of cells stably expressing 3xFLAG-GABARAPL1 show loss of puncta formation in ATG4B KO and ATG4 QKO cells. N = 67, 81, 76, 57, 95 and 66, respectively. Puncta number per cell is quantified blindly, and shown by median with 95% confidence interval. Statistical significance is assessed by ranked Mann-Whitney test. ns, not significant; *, p < 0.05; ****, p < 0.0001. CM, complete medium. (E) In ATG4B KO cells, LC3B and GL1 processing can be partially or fully rescued by high (CMV) or low (PGK1) overexpression of ATG4B (left). Western blot of ATG4B KO cells stably expressing ATG4B driven by each promoter (right).
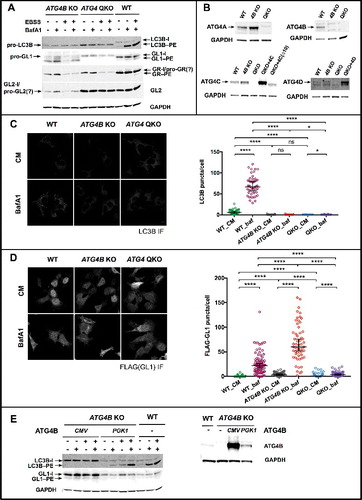
Figure 7. ATG4 QKO cells stably expressing ATG4B without its COOH-terminal LIR motif accumulate lipidated LC3/GABARAP-family proteins. (A) ATG4 QKO cells stably expressing either ATG4B or ATG4B without a C-terminal LIR motif (ATG4B[1-388]) under a low (PGK1)-expression promoter. (B) Representative anti-LC3B immunofluorescence images of ATG4 QKO expressing either construct. N = 19, 30, 30 and 18, respectively. (C) Representative anti-FLAG immunofluorescence images of ATG4 QKO cells expressing either construct, and stably expressing 3xFLAG-GABARAPL1 (GL1). N = 54, 79, 46 and 49, respectively. Puncta number per cell is quantified blindly, and shown by median with 95% confidence interval. Statistical significance is assessed by ranked Mann-Whitney test. ns, not significant; *, p < 0.05; ****, p < 0.0001. CM, complete medium. Representative western blots of 3xFLAG-GABARAPL1 processing are shown in Figure S9.
![Figure 7. ATG4 QKO cells stably expressing ATG4B without its COOH-terminal LIR motif accumulate lipidated LC3/GABARAP-family proteins. (A) ATG4 QKO cells stably expressing either ATG4B or ATG4B without a C-terminal LIR motif (ATG4B[1-388]) under a low (PGK1)-expression promoter. (B) Representative anti-LC3B immunofluorescence images of ATG4 QKO expressing either construct. N = 19, 30, 30 and 18, respectively. (C) Representative anti-FLAG immunofluorescence images of ATG4 QKO cells expressing either construct, and stably expressing 3xFLAG-GABARAPL1 (GL1). N = 54, 79, 46 and 49, respectively. Puncta number per cell is quantified blindly, and shown by median with 95% confidence interval. Statistical significance is assessed by ranked Mann-Whitney test. ns, not significant; *, p < 0.05; ****, p < 0.0001. CM, complete medium. Representative western blots of 3xFLAG-GABARAPL1 processing are shown in Figure S9.](/cms/asset/af85afc6-789f-418d-9a20-b783354666a8/kaup_a_1437341_f0007_oc.jpg)
Figure 8. Systematic analysis of ATG4 QKO rescued with a single ATG4 homolog. (A) ATG4 QKO stably expressing ATG4A driven by the CMV promoter. (B) ATG4 QKO stably expressing ATG4C or ATG4C without N-terminal extension (ATG4C[∆10]) driven by the CMV promoter. (C) ATG4 QKO stably expressing ATG4D or ATG4D without N-terminal extension (ATG4D[∆63]) driven by the CMV promoter.
![Figure 8. Systematic analysis of ATG4 QKO rescued with a single ATG4 homolog. (A) ATG4 QKO stably expressing ATG4A driven by the CMV promoter. (B) ATG4 QKO stably expressing ATG4C or ATG4C without N-terminal extension (ATG4C[∆10]) driven by the CMV promoter. (C) ATG4 QKO stably expressing ATG4D or ATG4D without N-terminal extension (ATG4D[∆63]) driven by the CMV promoter.](/cms/asset/1015773b-7cb6-4638-9651-d2bf2331752b/kaup_a_1437341_f0008_b.gif)
Table 1. N-termini of the proteins used in this study.
Table 2. Sequences immediately adjacent to the glycine in Atg8-family fusion proteins.
Table 3. CRISPR gRNAs tested and used for gene editing.