Figures & data
Figure 1. The low cytotoxic FCGR3− NK cells increase in ELM with disease progression. (a-c) The percentage and the ratio of FCGR3−:FCGR3+ NK cells in PF from women with or without EMS were analyzed by FCM (one-way ANOVA). (d) The expression of HLA-E, MICA/B and PVR on normESCs (n = 6) and ectoESCs (n = 6) was detected by FCM (Student t test). (e) After coculture with normESCs or ectoESCs for 48 h, the expression of LAMP1 on NK cells (n = 6) was detected by FCM (one-way ANOVA). (f) NK cells (n = 6) were cocultured with normESCs or ectoESCs for the cytotoxicity assay at different T/E (target cells:effector cells) ratios (1:100, 1:10, 1:1, 3:1 or 10:1) for 4 h (Student t test). (g) After coculture with ectoESCs for 48 h, the expression of LAMP1 on FCGR3+ NK cells and FCGR3− NK cells (n = 6) was analyzed by FCM (Student t test). Ctrl, PF from women without endometriosis (n = 10); EMS (I-II), PF from women with endometriosis were in early stages (stage I and II, n = 10); EMS (III-IV), PF from women with endometriosis were in advanced stages (stage III and IV, n = 10). normESC, normal ESCs from healthy women; ectoESC, ectopic ESCs from women with EMS. Data are expressed as the mean± SEM. *P < 0.05, **P < 0.01, ***P < 0.001 and ****P < 0.0001. NS, no statistical difference.
Figure 2. The low autophagy of ESCs leads to the high level of FCGR3− NK cells in vitro. (a) The expression of LC3B and BECN1 in normESC (n = 6) and ectoESC (n = 6) was analyzed by western blotting. (b) The expression of LC3B and BECN1 in normal ESC (n = 6) treated with or without 17β-estrogen (10−8 M) was analyzed by western blotting. (c,d) After coculture with Ctrl-ESC, 3-MA-ESC or Rap-ESC for 48 h, the ratio of FCGR3−:FCGR3+ NK cells (n = 6) was analyzed by FCM (one-way ANOVA). (e) The ATG5 mRNA levels in NC-ESC and siATG5-ESC by RT-PCR (Student t test). (f) After coculture with NC-ESC and siATG5-ESC for 48 h, the ratio of FCGR3−:FCGR3+ NK cells (n = 6) was analyzed by FCM (Student t test). (g) NK cells (n = 6) were cocultured with NC-ESC or siATG5-ESC for the cytotoxicity assay at different T/E ratios (1:100, 1:10, 1:1, 3:1 or 10:1) for 4 h (Student t test). E2, 17β-estrogen; Ctrl-ESC, normal ESCs; 3-MA-ESC, normal ESCs pretreated with 3-MA (10 mM) for 4 h; Rap-ESC, normal ESCs pretreated with rapamycin (1 mM) for 4 h. NC-ESC, Control ESCs transfected with control lentivirus; siATG5-ESC, ATG5-silenced ESCs transfected with ATG5 lentivirus. Data are expressed as the mean± SEM. **P < 0.01 and ***P < 0.001. NS, no statistical difference.
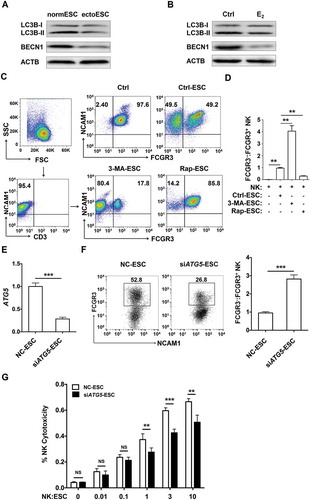
Figure 3. The low autophagy of ESCs triggers more differentiation of FCGR3− NK cells from FCGR3+ NK cells. (a,e) FCGR3+NK and FCGR3− NK cells were sorting from peripheral blood NK cells, and then labeling with PKH26 and PKH67, respectively. Then, PKH26-FCGR3+ NK and PKH67-FCGR3− NK cells (n = 6) were mixed and further cocultured with NC-ESC and siATG5-ESC (a). After 48 h, the positive ratio and MIF of MKI67 in PKH67+ NK cells (b), Zombie Aqua+ dead PKH26+ NK (c,d), and the differentiation of PKH26-FCGR3+ NK to PKH26-FCGR3− NK cells (c,e) were analyzed by FCM (Student t test). (f,g) The size and weight of EMS-like lesions from the EMS mouse model treated with vehicle, 3-MA (100 mg/kg/d) or Rap (100 mg/kg/d) (n = 6 mice/group) were measured (one-way ANOVA). (h,i) The C57BL/6 EMS mouse model was constructed, and treated with vehicle, 3-MA (100 mg/kg/d) or rapamycin (Rap, 100 mg/kg/d) (n = 6 mice/group) on day 3 and day 10 after surgery. Then the ratio of FCGR3−:FCGR3+ NK cells in PF was analyzed by FCM (one-way ANOVA). Data are expressed as the mean± SEM. **P < 0.05, **P < 0.01 and ***P < 0.001. NS, no statistical difference.
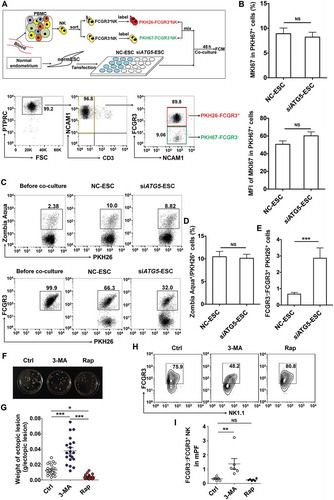
Figure 4. ESC autophagy upregulates expression of HCK by activating STAT3 signaling pathway. (a,b) The proteomic microarray was performed to evaluate the different proteins of cell lysate (A, left) and supernatant (B, left) between Ctrl-ESC and 3-MA-ESC. KEGG database-derived bioinformatics analysis was used to look for the differential expressions of proteins (non-cytokines) (A and B, right), which has the relationship with NK function molecules (FCGR3, KIR2DL1, KIR3DL1, NCR3, NCR2, NCR1, KLRK1, IFNG, PRF1 and GZMB). (c) The expression of HCK in normESC (n = 6), eutoESC (n = 6) and ectoESC (n = 6) was analyzed by western blotting. (d) The expression of HCK in Ctrl-ESC (n = 6), 3-MA-ESC (n = 6) or Rap-ESC (n = 6) was analyzed by western blotting. (e) The C57BL/6 EMS mice were treated with vehicle, 3-MA or Rap (n = 6 mice/group) on day 3 and day 10 after surgery. Then the transcriptional level of Map1lc3b, Becn1 and Hck in EMS-like lesions was detected by RT-PCR (one-way ANOVA). (f,g) NC-ESC and siATG5-ESC were stimulated with Rap (1 mM) for 4 h, and then cultured for another 12, 24, or 48 h, and the protein level of ATG5, BECN1, SQSTM1, LC3B and HCK, and the mRNA level of HCK was detected by western blotting and real-time PCR. (h,i) NC-ESC and siATG5-ESC were stimulated with Rap (1 mM) for 4 h, and then cultured for another 6, 12, or 24 h, and the level of phosphorylated and total STAT3 was analyzed by FCM. (j) Ctrl-ESC was treated with Rap (1 mM) for 4 h, and incubated with the selective inhibitor of STAT3 (HO-3867, 10 μM) for another 4 h, and then the mRNA level of HCK was analyzed by real-time PCR. eutoESC, ESCs of eutopic endometrium from women with EMS. Data are expressed as the mean± SEM. *P < 0.05, **P < 0.01, ***P < 0.001 and ****P < 0.001.
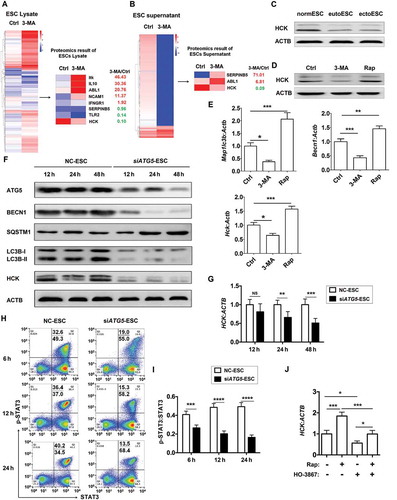
Figure 5. Hck downregulates FCGR3− NK cells. (a,b) The ratio of FCGR3−:FCGR3+ NK cells were analyzed after coculture with or without NC-ESC, HCK (OE)-ESC or siHCK-ESC by FCM (Student t test). (c) The endometrial fragment from Hck knockout (KO) mice (hck−/-) was intraperitoneally injected to wild-type mice (WT) for contrast with a hck special KO-EMS mouse model. (d) The level of MKI67 in USCs (left), and the weight of EMS-like lesions (right) from WT and hck−/- (n = 6 mice/group) EMS mice by FCM (Student t test). (e,f) The levels of PRF1+ NK, GZMB+ NK and IFNG+ NK cells were analyzed in PF from WT (n = 9 mice/group) and hck−/- (n = 10 mice/group) EMS mice by FCM (Student t test). NC-ESC, control ESCs transfected with GV230-vector plasmid; HCK (OE), HCK-overexpressing ESCs transfected with the GV230-HCK plasmid; WT: EMS mice (donor mice, WT mice); hck−/-, hck special KO-EMS mice (donor mice, hck−/- mice); USCs, mouse uterus stromal cells. Data are expressed as the mean± SEM. *P < 0.05, **P < 0.01, ***P < 0.001 and ****P < 0.001.
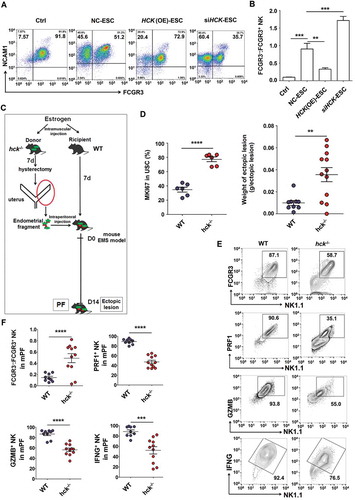
Figure 6. The low level of autophagy and HCK signaling stimulates the secretion of CXCL8 and IL23A by ESCs. (a,b) The differential expressions of cytokines (the differential fold > 10) in ESC lysate (a) and supernatants (b) by the proteomic microarray. (c) The differentially expressed cytokines IL1A, CXCL8 and IL23A were predicted as the downstream of HCK, according to KEGG database-derived signal net analysis. (d) The secretion levels of CXCL8, IL1A and IL23A from mock ESC (n = 6), HCK (OE)-ESC (n = 6), NC-ESC (n = 6) and siHCK-ESC (n = 6) were evaluated by ELISA (Student t test). (e) The levels of IL23A were evaluated in USCs of EMS-like lesions from WT (n = 6 mice/group) and hck−/- (n = 6 mice/group) EMS mice by FCM. (Student t test) mock, control ESCs transfected with GV230-vector plasmid; HCK (OE), HCK-overexpressing ESCs transfected with the GV230-HCK plasmid; Data are expressed as the mean± SEM. *P < 0.05, **P < 0.01 and ***P < 0.001.
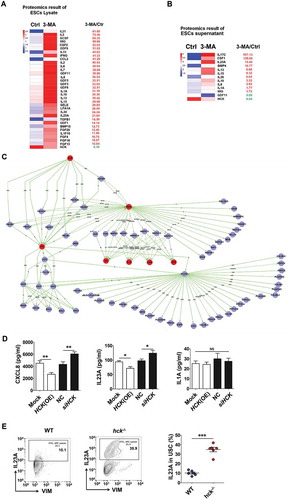
Figure 7. The HCK-CXCL8-IL23A signal axis of ESCs regulates FCGR3− NK cells differentiation. (a) KEGG database-derived bioinformatics analysis about the relationship between HCK downstream cytokines (CXCL8, IL23A and IL1A), Fc receptors FCGR3A and FCGR3B. (b) (left) After coculture with Ctrl-ESC, HCK (OE)-ESC, CXCL8 protein (100ng/ml) and/or IL23A (OE)-ESC for 48 h; (right) After coculture with Ctrl-ESC, siHCK-ESC, anti-CXCL8 (2 ug/ml) and/or siIL23A-ESC for 48 h, the ratio of FCGR3−:FCGR3+ NK cells (n = 6, right) were analyzed by FCM (one-way ANOVA). (c,d) The weights of EMS-like lesions from C57BL/6 EMS mice (n = 8 mice/group) were counted after treatment with or without intraperitoneal injection of anti-mouse IL23A neutralizing antibody (anti-IL23A, 0.1 mg/kg/d) on day 3 and day 10 (Student t test). (e,f) The concentration of CXCL8 and IL23A in PF from healthy control (n = 20) and EMS patients (stage III and IV, n = 20), supernatants of ESCs from healthy control (n = 10) and EMS patients (stage III and IV, n = 10) were detected by ELISA (Student t test). CXCL8, recombinant human CXCL8 protein; anti-CXCL8, anti-human CXCL8 neutralizing antibody. Data are expressed as the mean± SEM. *P < 0.05, **P < 0.01and ***P < 0.001 (compared to Ctrl-ESC); #P < 0.05 and ###P < 0.001 (compared to HCK (OE)-ESC or siHCK-ESC group).
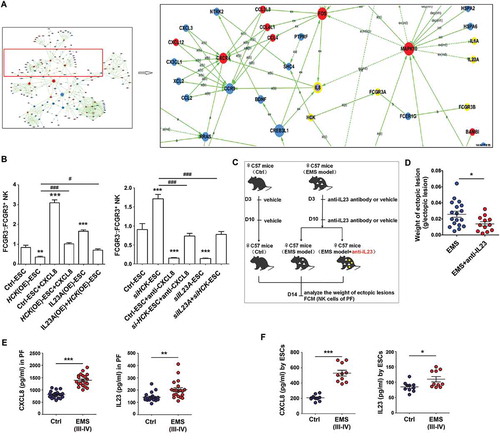
Figure 8. The FCGR3− NK cell differentiation in ELM is negatively regulated by MIR1185–1-3p. (a) The differential MicroRNAs (> 3-fold) in NK cells cocultured with Ctrl-ESC and 3-MA-ESC by microRNA 4.0 array. (b) The transcriptional levels of HsMIR1185-1-3p in NK cells (n = 6) were detected by RT-PCR, after coculture with Ctrl-ESC, 3-MA-ESC or Rap-ESC. In addition, the transcriptional levels of HsMIR1185-1-3p in NK cells (n = 6) cocultured with NC-ESC, HCK (OE)-ESC or siHCK-ESC were detected by RT-PCR (Student t test). (c,d) After coculture with Ctrl-ESC, IL23A (OE)-ESC, Ctrl-ESC plus CXCL8 protein (100 ng/ml) or IL23A (OE)-ESC plus CXCL8 protein (100 ng/ml), Ctrl-ESC, siIL23A-ESC, Ctrl-ESC plus anti-CXCL8 (2 µg/ml), or siIL23A-ESC plus anti-CXCL8 (2 µg/ml) for 48 h, the transcriptional levels of HsMIR1185-1-3p in NK cells (n = 6) were detected by RT-PCR (one-way ANOVA). (e) The transcriptional levels of HsMIR1185-1-3p in NK cells from healthy control (n = 6) and EMS patients (stage III and IV, n = 6) were detected by RT-PCR (Student t test). (f,g) FCM analysis of FCGR3, PRF1, GZMB and IFNG in NC NK cells (n = 6) and MIR1185-1-3p+ NK cells (n = 6) after coculture with normal ESCs (Student t test). NC, Ctrl NK cells transfected with control miRNA lentivirus; MIR1185-1-3p+, HsMIR1185-1-3p-overexpressing NK cells transfected with Mir-1185-1-3p mimic lentivirus. Data are expressed as the mean± SEM. *P < 0.05, **P < 0.01, ***P < 0.001 and ****P < 0.0001.
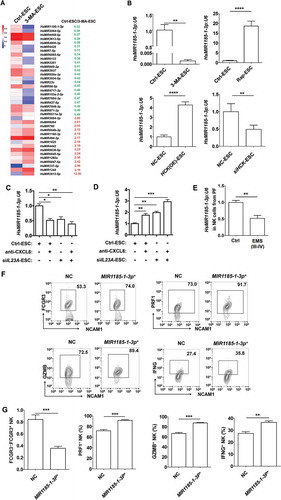
Figure 9. The autophagy and HCK signaling of ESCs are involved in regulating the PTGS2 level in NK cells by MIR1185-1-3p. . (a) The NK function-related genes in NK cells cocultured with Ctrl-ESC and 3-MA-ESC by Human Gene 2.0 ST Array. (b) The intersection analysis between differential genes in NK cells (coculture with Ctrl-ESC or 3-MA-ESC) and predicted target genes (i.e. EGR2, EREG and PTGS2) of MIR1185-1-3p. (c) The bioinformatics analysis (KEGG database-derived Signal net) about the relationship between PTGS2 (COX-2), FCGR3, CXCL8 and IL23A. (d,e) The relative luciferase activity of PTGS2 in HEK-293T cells was analyzed by a dual luciferase reporter assay, after cotransfection with plasmids (NC, MIR1185-1-3p mimics, MIR1185-1-3p inhibitor) and luciferase reporter plasmids (PTGS2-Luc [WT], PTGS2 mutation-Luc [MUT]) (Student t test). (f) FCM analysis of PTGS2 level in NC NK cells (n = 6) and MIR1185-1-3p + NK cells (n = 6) after coculture with Ctrl-ESC or siHCK-ESC (one-way ANOVA). (g) FCM analysis of PTGS2 level in NC NK cells (n = 6) and MIR1185-1-3p +NK cells (n = 6) after coculture with NC ESC or 3-MA-ESC (one-way ANOVA). (h) FCM analysis of PTGS2 level in NK cells of PF from WT (n = 9 mice/group) and hck−/- (n = 10 mice/group) EMS mice by FCM (Student t test). MIR1185-1-3p mimics, HsMIR1185-1-3p mimics; MIR1185-1-3p inhibitor, HsMIR1185-1-3p inhibitor. Data are expressed as the mean± SEM. **P < 0.01, ***P < 0.001 and ****P < 0.0001.
![Figure 9. The autophagy and HCK signaling of ESCs are involved in regulating the PTGS2 level in NK cells by MIR1185-1-3p. . (a) The NK function-related genes in NK cells cocultured with Ctrl-ESC and 3-MA-ESC by Human Gene 2.0 ST Array. (b) The intersection analysis between differential genes in NK cells (coculture with Ctrl-ESC or 3-MA-ESC) and predicted target genes (i.e. EGR2, EREG and PTGS2) of MIR1185-1-3p. (c) The bioinformatics analysis (KEGG database-derived Signal net) about the relationship between PTGS2 (COX-2), FCGR3, CXCL8 and IL23A. (d,e) The relative luciferase activity of PTGS2 in HEK-293T cells was analyzed by a dual luciferase reporter assay, after cotransfection with plasmids (NC, MIR1185-1-3p mimics, MIR1185-1-3p inhibitor) and luciferase reporter plasmids (PTGS2-Luc [WT], PTGS2 mutation-Luc [MUT]) (Student t test). (f) FCM analysis of PTGS2 level in NC NK cells (n = 6) and MIR1185-1-3p + NK cells (n = 6) after coculture with Ctrl-ESC or siHCK-ESC (one-way ANOVA). (g) FCM analysis of PTGS2 level in NC NK cells (n = 6) and MIR1185-1-3p +NK cells (n = 6) after coculture with NC ESC or 3-MA-ESC (one-way ANOVA). (h) FCM analysis of PTGS2 level in NK cells of PF from WT (n = 9 mice/group) and hck−/- (n = 10 mice/group) EMS mice by FCM (Student t test). MIR1185-1-3p mimics, HsMIR1185-1-3p mimics; MIR1185-1-3p inhibitor, HsMIR1185-1-3p inhibitor. Data are expressed as the mean± SEM. **P < 0.01, ***P < 0.001 and ****P < 0.0001.](/cms/asset/077a7af2-2e1b-4b09-b3e5-b38ffa77c1be/kaup_a_1476809_f0009_c.jpg)
Figure 10. There are more FCGR3+ PRF1+ GZMB+ IFNG+ NK cells in PF and the uterus of ptgs2−/- mice. (a) FCM analysis of FCGR3, IFNG and PRF1 in PTGS2+ NK and PTGS2− NK cells of PF from C57BL/6 mice (n = 6 mice/group) (Student t test). (b,c) The ratio of FCGR3−:FCGR3+ NK cells were analyzed in PF and uterus from WT, ptgs± and ptgs−/- mice (n = 6 mice/group) by FCM (one-way ANOVA). (d) FCM analysis of PRF1, GZMB and IFNG in NK cells of PF and uterus from WT, ptgs2+/- and ptgs2−/- mice (n = 6 mice/group) by FCM (one-way ANOVA). Data are expressed as the mean± SEM. *P < 0.05, **P < 0.01 and ***P < 0.001.

Figure 11. PTGS2+ FCGR3− NK cells present low levels of PRF1, GZMB and IFNG. (a) The expression of PTGS2 (n = 5) in NK cells cocultured with ESCs and treated with or without anti-FCGR3 (10 µg/ml) for 24 h was analyzed by western blotting. (b-d) FCM analysis of PTGS2, PRF1, GZMB and IFNG in NK cells of PF and uterus from WT and fcgr3−/- mice (n = 6 mice/group) by FCM (Student t test). (e,f) The C57BL/6 EMS mice were treated with vehicle, anti-FCGR3 (0.25 mg/kg/d) or celecoxib (5 mg/kg/d) (n = 6 mice/group) on day 3 and day 10 after surgery. Then the levels of PTGS2, GZMB and IFNG in NK cells of PF were detected by FCM (one-way ANOVA). (g) The ratio of PTGS2+ FCGR3− to PTGS2− FCGR3+ NK cells was analyzed in PF from healthy controls (n = 10) and EMS patients (stage III and IV, n = 10) by FCM (Student t test). Anti-FCGR3, anti-FCGR3 neutralizing antibody. Data are expressed as the mean± SEM. *P < 0.05, **P < 0.01 and ***P < 0.001.
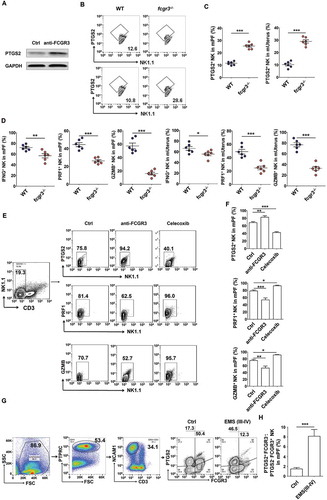
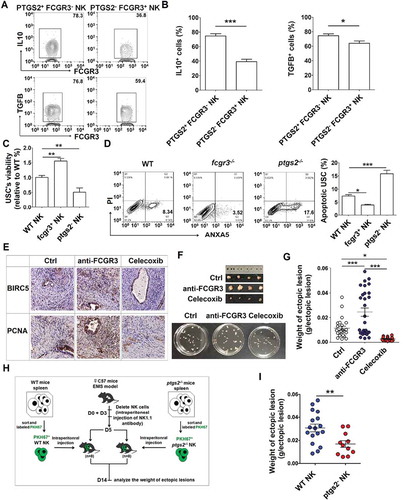
Figure 12. PTGS2highFCGR3− NK cells accelerate the growth of ectopic lesion and progression of EMS. (a,b) The expression of IL10 and TGFB in PTGS2+ FCGR3− NK cells and PTGS2− FCGR3+ NK cells in PF from patients with EMS (stage III and IV) (n = 10) was analyzed by FCM (Student t test). (c,d) The NK cells from WT, fcgr3−/- or ptgs2−/- mice were cocultured with mouse uterus stromal cells (USCs) for 48 h, and then the viability and apoptosis of USCs in vitro were analyzed by CCK8 assay (c) and apoptosis assay (d) (one-way ANOVA). (e) Immunohistochemistry analysis for the expression of BIRC5/survivin and PCNA in EMS-like lesions, in the EMS mouse model treated with vehicle, anti-FCGR3 (0.25 mg/kg/d) or celecoxib (5 mg/kg/d) (n = 6 mice/group). Original magnification: × 200. (f,g) The weight of EMS-like lesions in the EMS mouse model treated with vehicle, anti-FCGR3 or celecoxib (n = 6 mice/group) (one-way ANOVA). (h,i) The weight of EMS-like lesions in the NK-depleted EMS mouse model (anti-NK1.1 antibodies on days 0 and 3) treated with NK cells (day 5) from WT or ptgs2−/- mice (n = 8 mice/group) (Student t test). Data are expressed as the mean± SEM. *P < 0.05, **P < 0.01, ***P < 0.001 and ****P < 0.0001.