Figures & data
Figure 1. HIV-1 TAT initiates mitophagy in mPMs. (a–c) HIV-1 TAT dose-dependently upregulated the expression of mitophagy markers – PINK1 (a), PRKN (b), and DNM1L (c) in mPMs. (d–f) HIV-1 TAT time-dependently upregulated the expression of mitophagy markers such as PINK1 (d), PRKN (e), and DNM1L (f) in mPMs. (g–i) Time-dependent upregulation of the mitophagy markers – PINK1 (g), PRKN (h), and DNM1L (i) in the mitochondria isolated from mPMs exposed to HIV-1 TAT (50 ng/mL). (j–l) Time-dependent upregulation of the mitophagy markers – PINK1 (j), PRKN (k), and DNM1L (l) in the cytosolic fractions of mPMs exposed to HIV-1 TAT (50 ng/mL). Either ACTB (for total and cytosolic) or VDAC (for mitochondria) was probed as a protein loading control. The data are presented as mean ± SEM from 6 independent experiments. Nonparametric Kruskal-Wallis One-way ANOVA followed by the Dunn post hoc test was used to determine the statistical significance between multiple groups. *, P < 0.05 vs. control
Figure 2. HIV-1 TAT alters mitochondrial membrane potential and initiates mitophagy in mPMs. (a–c) HIV-1 TAT time-dependently upregulated the expression of autophagy markers such as BECN1 (a), MAP1LC3B-II (b), and SQSTM1 (c) in mPMs. (d and e) HIV-1 TAT decreases mitochondrial membrane potential in mPMs. (d) Exposure with HIV-1 TAT (50 ng/mL; 24 h) resulted in a reduction of the JC-1 dye aggregation in the mitochondria and decreased ratio of the aggregate (red) to monomer JC-1 (green) in mPMs. Scale bar: 100 µm. (e) Quantification of JC-1 staining in mPMs exposed to HIV-1 TAT (50 ng/mL) for 24 h. The data are presented as mean ± SEM from 6 independent experiments. Nonparametric Kruskal-Wallis One-way ANOVA followed by the Dunn post hoc test was used to determine the statistical significance between multiple groups and Wilcoxon test was used to compare between 2 groups. *, P < 0.05 vs. control
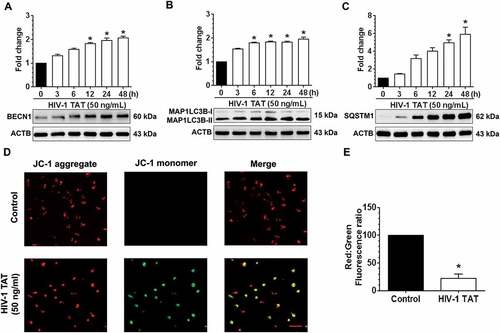
Figure 3. HIV-1 TAT-mediated mitochondrial dysfunction and increased mitophagosome formation in mPMs. (a–c) HIV-1 TAT significantly impaired mitochondrial function. (a) mitochondrial OCR and (b) ECAR were determined using a Seahorse XFp Extracellular Flux Analyzer in mPMs exposed to HIV-1 TAT (50 ng/mL) for 24 h. (c) Bar graph showing individual mitochondrial function parameters calculated from data in panel A. The data are presented as mean ± SEM from 6 independent experiments. The Wilcoxon test was used to compare between 2 groups. *, P < 0.05 vs. control. (d) Transmission electron microscopic images of mitochondrial ultrastructure and mitophagosomes in mPMs exposed to HIV-1 TAT (50 ng/mL) for 24 h. N, nucleus; M, mitochondria; ER, endoplasmic reticulum; AV, autophagic vesicle; AL, autolysosome. (e) Representative fluorescence images showing the accumulation of mitophagosomes in mPMs transfected with GFP- MAP1LC3 and pLV-mitoDsRed followed by exposure to HIV-TAT (50 ng/mL), and in cells treated with rotenone (1 μM) for 24 h. Scale bar: 5 μm
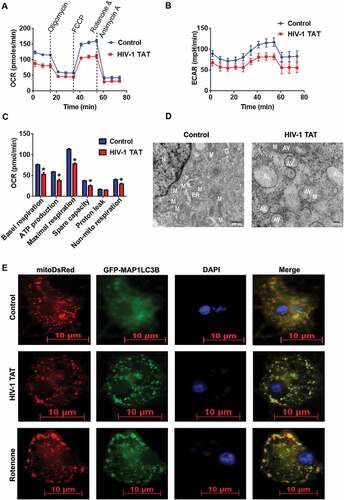
Figure 4. HIV-1 TAT increases autophagosome formation and decreases autophagic flux in mPMs. (a and b) Representative western blots showing the expression of MAP1LC3B-II (a) and SQSTM1 (b) in mPMs exposed to HIV-1 TAT (50 ng/mL) for 24 h followed by treatment with 400 nM BAF, added in the last 4 h of the 24 h treatment period. ACTB was probed as a loading control for all experiments. (c) mPMs transfected with tandem fluorescent-tagged MAP1LC3B plasmid followed by HIV-1 TAT (50 ng/mL) and treated with rapamycin (10 nM) for 24 h. Scale bar: 5 μm. (d and e) Bar graph showing the number of autophagosomes (d) and autolysosomes (e) in mPMs transfected with tandem fluorescent-tagged MAP1LC3B plasmid and treated with HIV-1 TAT and rapamycin for 24 h. The data are presented as mean ± SEM from 6 independent experiments. Nonparametric Kruskal – Wallis One-way ANOVA followed by the Dunn post hoc test was used to determine the statistical significance between multiple groups and the Wilcoxon test was used to compare between 2 groups: *, P < 0.05 vs. control
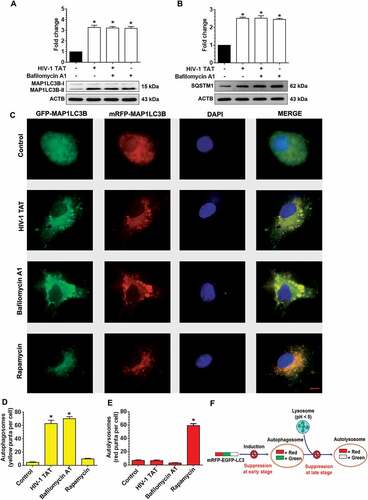
Figure 5. Pharmacological and gene silencing of autophagy blocks HIV-1 TAT-mediated mitophagy. (a–f) Representative western blots showing expression of mitophagy markers such as PINK1 (a), PRKN (b), and DNM1L (c) and autophagy markers such as BECN1 (d), MAP1LC3B-II (e), and SQSTM1 (f) in mPMs pretreated with 5 mM 3-methyladenine (3-MA) and 100 nM of wortmannin for 1 h following exposure with HIV-1 TAT (50 ng/mL) for 24 h. (g–l) Representative western blots showing the protein expression of PINK1 (g), PRKN (h), and DNM1L (I), BECN1 (j), MAP1LC3B-II (k), and SQSTM1 (l) in mPMs transfected with Becn1 siRNA and scrambled siRNA following exposure with HIV-1 TAT (50 ng/mL) for 24 h. ACTB was probed as a protein loading control for all experiments. The data are presented as mean ± SEM from 6 independent experiments. Nonparametric Kruskal-Wallis One-way ANOVA followed by the Dunn post hoc test was used to determine the statistical significance between multiple groups. P < 0.05 vs. control; #, P < 0.05 vs. HIV-1 TAT
Figure 6. Pharmacological and gene silencing of mitophagy blocks HIV-1 TAT-mediated mitophagy. (a–f) Representative western blots showing expression of mitophagy markers such as PINK1 (a), PRKN (b), and DNM1L (c) and autophagy markers such as MAP1LC3-II (d), SQSTM1 (e), and BECN1(f) in mPMs pretreated with 25 μM Mdivi-1 (a mitophagy inhibitor) for 1 h following exposure with HIV-1 TAT (50 ng/mL) for 24 h. (g–l) Representative western blots showing expression of PINK1 (g), PRKN (H), and DNM1L (I), MAP1LC3B-II (j), SQSTM1 (k), and BECN1 (l) in mPMs transfected with either Pink1 siRNA or scrambled siRNA, following exposure to HIV-1 TAT (50 ng/mL) for 24 h. ACTB was probed as a protein loading control for all experiments. Nonparametric Kruskal-Wallis One-way ANOVA followed by the Dunn post hoc test was used to determine the statistical significance between multiple groups. P < 0.05 vs. control; #, P < 0.05 vs. HIV-1 TAT
Figure 7. HIV-1 TAT-mediated defective mitophagy increases microglial activation and elevates proinflammatory cytokines. (a and b) Representative western blots showing the increased expression of AIF1, a microglial activation marker in mPMs pretreated with 5mM 3-MA and 100 nM wortmannin (a), or in cells pretreated with 25 μM Mdivi-1 (b) for 1 h following exposure to HIV-1 TAT for 24 h. (c and d) Representative western blots showing increased expression of AIF1 in mPMs transfected with either Becn1 siRNA or scrambled siRNA (c) or with Pink1 siRNA or scrambled siRNA (d) following exposure to HIV-1 TAT for 24 h. ACTB was probed as a protein loading control for all experiments. (e and f) Representative bar graphs showing the mRNA expression profile of proinflammatory cytokines such as Tnf, Il1b, and Il6 using qPCR in mPMs pretreated with 5 mM of 3-MA and 100 nM of wortmannin (e) or pretreated with 25 μM Mdivi-1 (f) for 1 h following exposure with HIV-1 TAT for 24 h. (g and h) Representative bar graphs showing the mRNA expression profile of proinflammatory cytokines such as Tnf, Il1b, and Il6 using qPCR in mPMs transfected with either Becn1 siRNA and scrambled siRNA (g) or transfected with either Pink1 siRNA or scrambled siRNA (h) following exposure with HIV-1 TAT for 24 h. Gapdh was used as an internal control to normalize the gene expression for all experiments. Nonparametric Kruskal-Wallis One-way ANOVA followed by the Dunn post hoc test was used to determine the statistical significance between multiple groups. P < 0.05 vs. control; #, P < 0.05 vs. HIV-1 TAT
Figure 8. Gene silencing of Pink1 and Becn1 partially inhibited HIV-1 TAT-mediated mitochondrial dysfunction in mPMs. (a and b) Graphical representation of the OCR measurement over time in mPMs transfected with either Pink1 siRNA and scrambled siRNA (a) or transfected with either Becn1 siRNA or scrambled siRNA (b) following exposure to HIV-1 TAT for 24 h. (c and d) Graphical representation of the ECAR measurement over time in mPMs transfected with either Pink1 siRNA and scrambled siRNA (c) or transfected with either Becn1 siRNA and scrambled siRNA (d) following exposure to HIV-1 TAT for 24 h. (e and F) Bar graphs showing the relative parameters of the mitochondrial respiratory function in mPMs transfected with either Pink1 siRNA (e) or Becn1 siRNA (f) calculated from respective panel A or panel B. The data are presented as mean ± SEM from 6 independent experiments. Nonparametric Kruskal-Wallis One-way ANOVA followed by the Dunn post hoc test was used to determine the statistical significance between multiple groups. P < 0.05 vs. control; #, P < 0.05 vs. HIV-1 TAT. NS, not significant
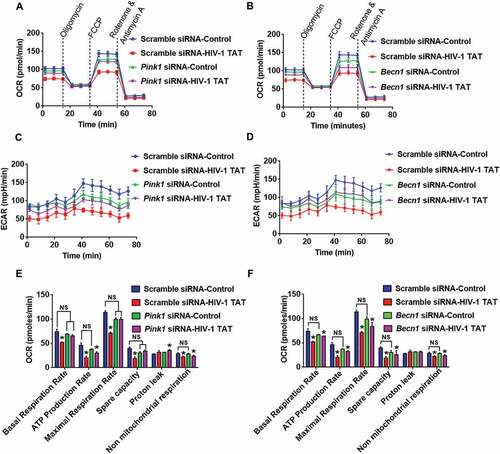
Figure 9. HIV-1 mediated upregulation of mitophagy markers and proinflammatory cytokines in vivo. (a–f) Representative western blots showing the activation of mitophagy markers such as PINK1 (a), PRKN (b), and DNM1L (C) and autophagy markers such as BECN1 (d), MAP1LC3B-II (e), and SQSTM1 (f) in the frontal cortex of wild-type and HIV-1 Tg rats (n = 3). ACTB was probed as a protein loading control for all experiments. (g–i) Representative bar graphs showing the mRNA expression profile of proinflammatory cytokines such as Tnf (g), Il1b (h), and Il6 (I) using qPCR in the frontal cortex of wild-type and HIV-1 Tg rats (n = 3). Gapdh was used as an internal control to normalize the gene expression for all experiments. The data are presented as mean ± SEM from 3 independent experiments. An unpaired Student t test was used to determine the statistical significance. *, P < 0.05 vs. WT
Figure 10. HIV-1 mediated upregulation of mitophagy markers and microglial activation in vivo. (a) Immunofluorescence staining for PINK1 (green), ITGAM, microglial activation marker (red), and DAPI (blue) in the frontal cortices of wild-type and HIV-1 Tg rats. (b) Immunofluorescence staining for DNM1L (green), ITGAM, microglial activation marker (red), and DAPI (blue) from frontal cortex area of wild-type and HIV-1 Tg rats. (c) Immunofluorescence staining for MAP1LC3 (green), ITGAM, microglial activation marker (red), and DAPI (blue) from frontal cortex area of wild-type and HIV-1 Tg rats. Scale bar: 10 μm
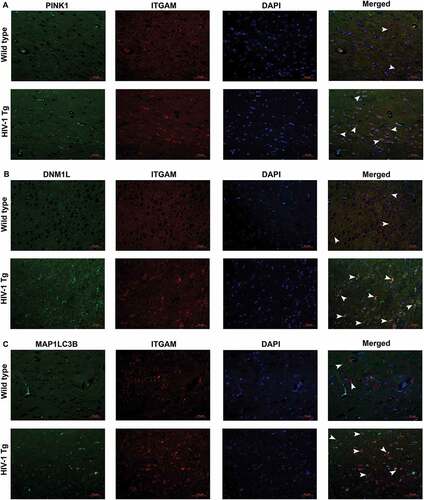
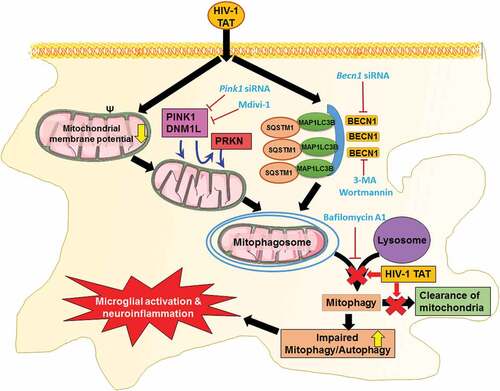
Figure 11. Schematic diagram outlining HIV-1 TAT-mediated defective mitophagy and microglial activation. Exposure of microglial to HIV-1 TAT decreases mitochondrial membrane potential, leading in turn, to mitochondrial dysfunction, that was followed by initiation of mitophagy and mitophagosomes formation. Exposure to HIV-1 TAT, however, blocked mitophagosome maturation, thereby leading to impaired clearance of damaged mitochondria. Accumulation of mitophagosome due to defective mitophagy resulted in microglial activation and increased the release of proinflammatory cytokines, leading to neuroinflammation