Figures & data
Figure 1. RNAi screen identifies PRPF8 as a regulator of mitophagy. (a) Representative confocal images of HeLa cells stably expressing mt-Keima subjected to hypoxia (1% O2) for the indicated times. (b) Graphical representation of the siRNA screen output. The ‘Z-score’ conveys the distribution of mitophagic activity per well across the entire library (see details in Methods). Data ordered from most negative to positive. Dashed lines are screen-specific cutoffs for active siRNA reagents. Blue dots represent positive control siRNAs. (c) mt-Keima imaging in HeLa cells transfected with the indicated siRNAs in a normoxic (21% O2) environment or after 24 h of hypoxia (1% O2). (d) Quantified mitophagy index in (c). Mitophagy index in hypoxia-treated control cells was normalized to ‘1ʹ. n = 3 independent experiments. (e) Western blot analysis of HeLa cells transfected with siRNAs after hypoxia treatment (1% O2, 24 h) with the indicated antibodies. (f) mt-Keima imaging in HeLa cells transfected with PRPF8 siRNA and GFP-PRPF8 siRNA-resistant plasmid after hypoxia treatment (1% O2, 24 h). GFP fluorescence is depicted in gray. Arrows indicate GFP-PRPF8-transfected cells. (g) Quantification of mitophagy index of GFP-positive cells in (f). Mitophagy index in hypoxia-treated control cells was normalized to ‘1ʹ. n = 3 independent experiments. Data are shown as the mean ± SD (One-way ANOVA, *p < 0.05, ***p < 0.001). Scale bars: 10 μm.
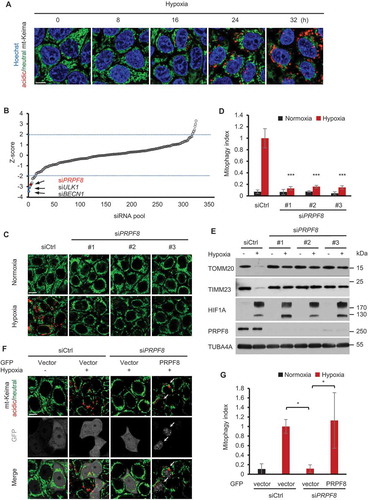
Figure 2. PRPF8 is required for hypoxia-induced mitophagosome formation. (a) Representative images of HeLa cells expressing GFP-LC3B transfected with the indicated siRNAs following normoxia or hypoxia (1% O2, 12 h) treatment. Scale bar: 10 μm. (b) Quantification of the number of GFP-LC3B puncta per cell in (A). n = 3 independent experiments. Data are shown as the mean ± SD. (c) Representative confocal images of colocalization of GFP-LC3B puncta and mitochondria (red, anti-TOMM20) in HeLa cells transfected with the indicated siRNAs during growth in normoxia or hypoxia (1% O2) for 32 h. Scale bar: 10 μm. White arrows indicate GFP-LC3B puncta colocalized with mitochondria. (d) Quantification of colocalization of GFP-LC3B puncta and mitochondria in (c). n = 3 independent experiments. Data are shown as the mean ± SD. (e) Electron microscopy images of murine 661W photoreceptor-derived cells transfected with the indicated siRNAs after hypoxia (1% O2, 36 h) treatment. N, nucleus. Scale bar: 1 μm. Arrows indicate autophagosomes. (f) Quantification of the number of autophagosomes per μm2 in (E). n = 13 siCtrl cells and 16 siPrpf8 cells. Data are shown as the mean ± SD in (B) and (D) (One-way ANOVA, ***p < 0.001). Data are shown as the mean ± SD in (F) (Mann-Whitney test, ***p < 0.001).
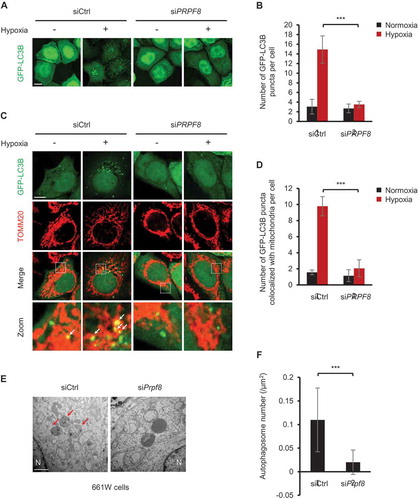
Figure 3. PRPF8 regulates ULK1 gene expression during mitophagy. (a) Western blot analysis of subcellular fractions of HeLa cells in normoxia or hypoxia (1% O2) for 24 h with the indicated antibodies. WCL, whole-cell lysate. (b) Representative immunofluorescence images of HeLa cells in normoxia or hypoxia (1% O2) for 24 h with the indicated antibodies. Mitochondria are labelled with HSPD1/HSP60 and nuclei are labelled with Hoechst. Scale bar: 5 μm. (c) Quantitative real-time PCR analysis of mRNA levels for the indicated genes in HeLa cells. Data are shown as the mean ± SD from a representative of 3 independent experiments (One-way ANOVA, **p < 0.01). (d) Western blot analysis of ULK1 and other genes involved in mitophagosome formation in HeLa cells transfected with the indicated siRNAs during normoxia or hypoxia (1% O2, 24 h). ‘※’indicates the ATG12–ATG5 conjugate.
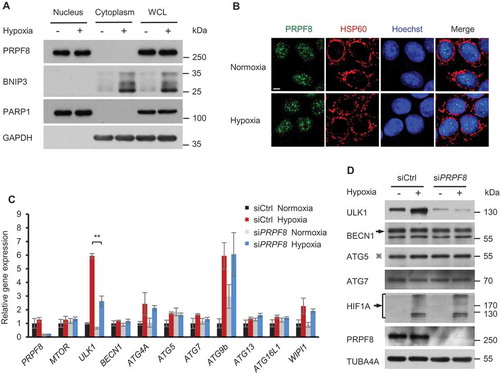
Figure 4. PRPF8 is required for mitophagy through regulating ULK1 mRNA splicing. (a) A representative gel picture shows bands corresponding to normal and aberrant skipping spliced products of ULK1 mRNA in HeLa cells transfected with the indicated siRNAs during normoxia or hypoxia (1% O2, 24 h) in RT-PCR assays. (b) The percentage of the PCR product representing exon 22 and exon 22–23 skipped transcripts in the total transcripts is calculated by band intensity quantification in (a) and is shown as ‘percent skipped’ on the y axis. n = 3 independent experiments. (c) Representative confocal images of RFP-LC3B signals in HeLa cells transfected with the siRNAs and plasmids as shown under normoxia or hypoxia (1% O2) for 12 h. (d) Quantification of the number of RFP-LC3B puncta per cell in (C). n = 3 independent experiments. (e) mt-Keima imaging in HeLa cells transfected with PRPF8 siRNA and GFP-tagged ULK1 plasmid after hypoxia treatment (1% O2, 24 h). GFP fluorescence is depicted in gray. Arrows indicate GFP-ULK1-transfected cells. (f) Quantification of mitophagy index of GFP-positive cells in (E). Mitophagy index in hypoxia-treated control cells was normalized to ‘1ʹ. n = 3 independent experiments. Data are shown as the mean ± SD (One-way ANOVA, **p < 0.01, ***p < 0.001). Scale bars: 10 μm.
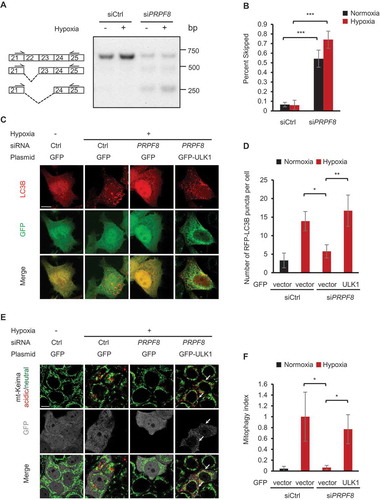
Figure 5. PRPF8 retinitis pigmentosa disease-associated mutant has defects in mitophagy. (a) mt-Keima imaging in HeLa cells transfected with PRPF8 siRNA and GFP-tagged PRPF8 siRNA-resistant plasmid after hypoxia treatment (1% O2, 24 h). GFP fluorescence is depicted in gray. (b) Quantification of mitophagy index of GFP-positive cells in (A). Mitophagy index in hypoxia-treated control cells was normalized to ‘1ʹ. n = 4 independent experiments. (c) mt-Keima imaging in RPE cells transfected with PRPF8 siRNA and GFP-tagged PRPF8 siRNA-resistant plasmid after hypoxia treatment (1% O2, 24 h). GFP fluorescence is depicted in gray. Arrows indicate GFP-PRPF8-transfected cells. (d) Quantification of mitophagy index of GFP-positive cells in (c). Mitophagy index in hypoxia-treated control cells was normalized to ‘1ʹ. n = 3 independent experiments. (e) Representative confocal images of RFP-LC3B signals in HeLa cells transfected with the siRNAs and plasmids as shown under normoxia or hypoxia (1% O2) for 12 h. (f) Quantification of the number of RFP-LC3B puncta per cell in (E). n = 3 independent experiments. Data are shown as the mean ± SD (One-way ANOVA, *p < 0.05, **p < 0.01, NS, nonsignificant). Scale bars: 10 μm.
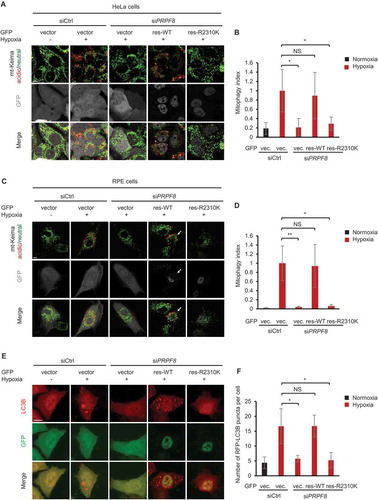
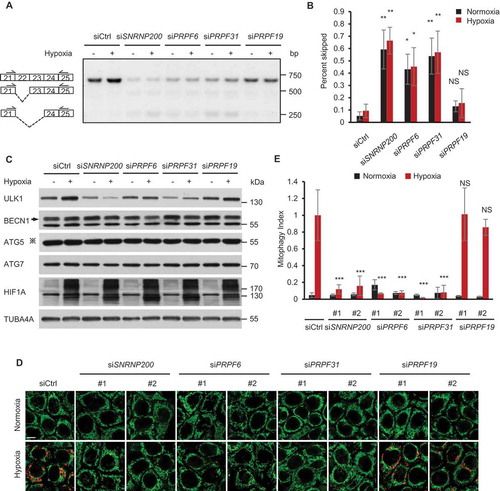
Figure 6. Retinitis pigmentosa-associated spliceosomal proteins regulate mitophagy under hypoxia. (a) A representative gel picture shows bands corresponding to normal and aberrant skipping spliced products of ULK1 mRNA in HeLa cells transfected with the indicated siRNAs during normoxia or hypoxia (1% O2, 24 h) in RT-PCR assays. (b) The percentage of the PCR product representing exon 22 and exon 22–23 skipped transcripts in the total transcripts is calculated by band intensity quantification in (a) and is shown as ‘percent skipped’ on the y axis. n = 3 independent experiments. (c) Western blot analysis of HeLa cells transfected with siRNAs after hypoxia treatment (1% O2, 24 h) with the indicated antibodies. ‘※’indicates the ATG12–ATG5 conjugate. (d) mt-Keima imaging in HeLa cells transfected as indicated in a normoxic (21% O2) environment or after 24 h of hypoxia (1% O2). Scale bar: 10 μm. (e) Quantified mitophagy index in (d). Mitophagy index in hypoxia-treated control cells was normalized to ‘1ʹ. n = 3 independent experiments. Data are shown as the mean ± SD (One-way ANOVA, *p < 0.05, **p < 0.01, ***p < 0.001, NS, nonsignificant).