Figures & data
Table 1. Data collection and refinement statistics.
Figure 1. Structure of ATG101-ATG13HORMA complex. (a) Our HsATG101-ATG13HORMA complex showing the C-terminal helix of ATG101. ATG101 and ATG13HORMA are colored yellow and magenta, respectively. The unique C-terminal region of ATG101 is highlighted as green. (b) Superposition of HsATG101 structures showing clear differences in 2 regions, the WF-finger and the C-terminal region, which are highlighted by red and blue dotted circles, respectively. Our HsATG101-ATG13HORMA structure is colored as panel (A). The previous HsATG101-ATG13HORMA structure (C-terminal deleted version of HsATG101; PDB ID: 5C50) is colored slate and gray for ATG101 and ATG13, respectively. Free HsATG101 (β-sheet conformation of C-terminal region; PDB ID: 4WZG) is colored sky blue. (c) Superposition of all our structures of HsATG101 showing the flexibility of the C-terminal region. The HsATG101 with a helical C-terminal region is colored as panel (A) and that with random coil colored pink. (d) A close-up view of the interaction between the C-terminal region of HsATG101 and neighboring symmetry-equivalent ATG13 molecule shown in dark gray surface. The exposed aliphatic carbon atoms of Thr202, Val204, and Thr206 in ATG101 are stabilized by hydrophobic residues including Tyr152 in neighboring ATG13 in crystalline packing. (e) Our crystal structure of ATG101-ATG13HORMA and a modeled complex with the C-terminal β-sheet structure of ATG101 were fitted into the low-resolution molecular envelope generated from SAXS data. The C-terminal flexible α-helix of ATG101 colored green shows discrepancy for the SAXS molecular envelope and the simple rigid-body motion of the region colored magenta fits well into the SAXS envelope.
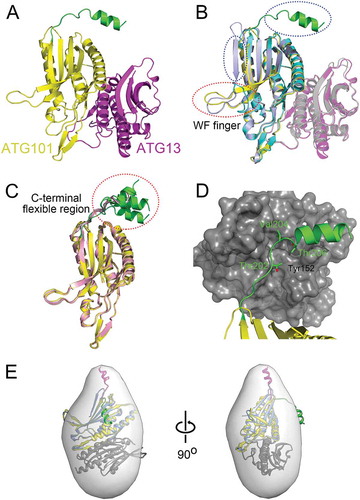
Figure 2. The C-terminal flexible region of ATG101 is important to the interaction with PtdIns3K complex components. To determine the role of the C-terminal region of ATG101 on PtdIns3K complex binding, either full-length wild-type Flag-ATG101 or C-terminal deletion Flag-ATG101 mutant (Flag-ATG101ΔC) were co-transfected with plasmids encoding PtdIns3K complex subunits (HA-ATG14 [A], HA-UVRAG [B], Myc-BECN1 [C], and HA-PIK3C3 [D]) into HEK293 cells as indicated. Flag-ATG101s were immunoprecipitated with anti-Flag antibody coupled with protein G-Sepharose and the immunoprecipitates were examined by western blots using the indicated antibodies. ACTB was used as a loading control.
![Figure 2. The C-terminal flexible region of ATG101 is important to the interaction with PtdIns3K complex components. To determine the role of the C-terminal region of ATG101 on PtdIns3K complex binding, either full-length wild-type Flag-ATG101 or C-terminal deletion Flag-ATG101 mutant (Flag-ATG101ΔC) were co-transfected with plasmids encoding PtdIns3K complex subunits (HA-ATG14 [A], HA-UVRAG [B], Myc-BECN1 [C], and HA-PIK3C3 [D]) into HEK293 cells as indicated. Flag-ATG101s were immunoprecipitated with anti-Flag antibody coupled with protein G-Sepharose and the immunoprecipitates were examined by western blots using the indicated antibodies. ACTB was used as a loading control.](/cms/asset/c30d978e-3d66-4d78-8874-ebe548027548/kaup_a_1504716_f0002_b.gif)
Figure 3. ATG101 directly interacts with the PtdIns3K complex through its C terminus. GST proteins (4.5%) used in the binding assay and 20% of final ATG101-PtdIns3K complex binding product in vitro were subjected to the analysis as described in Materials and Methods. *, non-specific band (presumably IgG heavy-chain). (B) Quantification data for the interaction between ATG101 and PtdIns3K complex in presence or absence of HA-ATG14. Fold changes are represented by an assay background as a reference (mean ± S.D.; n = 3; **, P < 0.01; *, P < 0.05).
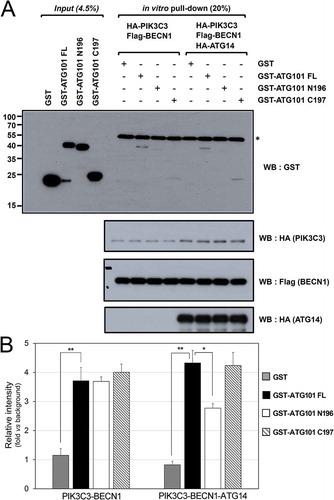
Figure 4. The WF finger motif of ATG101 is not responsible for binding to PtdIns3K complex. To determine the function of WF motif of ATG101, full-length wild-type Flag-ATG101 (Flag-ATG101-WPF) or full-length Flag-ATG101 mutants (Flag-ATG101 APA, Flag-ATG101 SPS) were co-transfected with PtdIns3K complex components (HA-ATG14 [A], HA-UVRAG [B], HA-PIK3C3 [C], and myc-BECN1 [D]) into HEK293 cells. For western blotting, cells were harvested and immunoblotted with the indicated antibodies. GAPDH was used as a loading control.
![Figure 4. The WF finger motif of ATG101 is not responsible for binding to PtdIns3K complex. To determine the function of WF motif of ATG101, full-length wild-type Flag-ATG101 (Flag-ATG101-WPF) or full-length Flag-ATG101 mutants (Flag-ATG101 APA, Flag-ATG101 SPS) were co-transfected with PtdIns3K complex components (HA-ATG14 [A], HA-UVRAG [B], HA-PIK3C3 [C], and myc-BECN1 [D]) into HEK293 cells. For western blotting, cells were harvested and immunoblotted with the indicated antibodies. GAPDH was used as a loading control.](/cms/asset/7c633758-785a-4274-87d1-2a5412b0f2d8/kaup_a_1504716_f0004_b.gif)
Figure 5. The role of the C-terminal region of ATG101 in the autophagy pathway. Autophagy defect shown in ATG101 knockout cells is restored by the expression of full-length ATG101 but not ATG101ΔC. (a) ATG101-knockout MIA PaCa-2 cells were transfected by a full-length wild-type of ATG101 (WT), a C-terminal deletion mutant of ATG101 (ΔC), and full-length ATG101 APA mutant (APA), respectively, and incubated for 48 h. After replacement with complete media containing 5 μM rapamycin (Sigma, R8781) with or without 100 μM chloroquine (CQ; Sigma, C6628), cells were further incubated for 2 h. For western blotting, cells were harvested and immunoblotted for ATG101, LC3, SQSTM1, and TUBA. (b) GFP-LC3 puncta were analyzed by live imaging using fluorescence microscopy after 2 h incubation of either complete (DMEM) or amino acid-depleted (-AA) media. Scale bar: 50 μm. (c) Quantification data for GFP-LC3 puncta area are expressed as a percentage of the DAPI area within the cell. NS, *, and ** mean P > 0.05, P < 0.05, and P < 0.01, respectively.
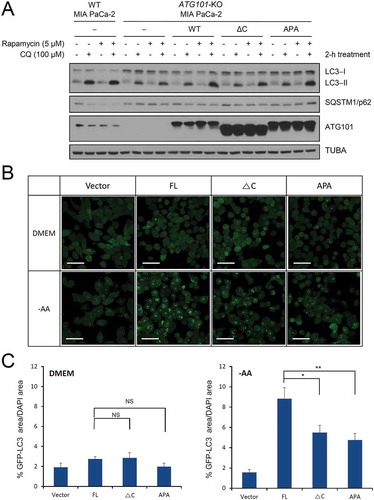
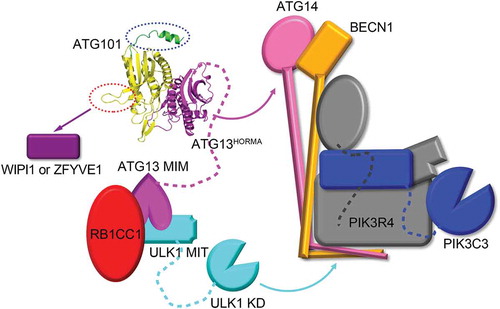
Figure 6. A model of the function of ATG101 in the ULK1 complex. The interaction between ATG13HORMA and ATG14 is indicated with the magenta curved arrow and the ULK1 kinase phosphorylates several components of PtdIns3K complex indicated by the cyan curved arrow. The C-terminal region of ATG101 (green ribbon) that binds to PtdIns3K complexes (C1 and C2) and is indicated by the blue dotted oval. A WF finger of ATG101 (red dotted oval) cannot interact with the PtdIns3K complex but affects WIPI1 or ZFYVE1 function indicated by the purple arrow. KD, kinase domain; MIT, microtubule interacting and transport; MIM, MIT-interacting motif; RB1CC1, RB1 inducible coiled-coil 1; WIPI1, WD repeat domain, phosphoinositide interacting 1; ZFYVE1, zinc finger FYVE-type containing 1.