
Figures & data
Figure 1. Autophagy is specifically inhibited in atg7Δ mice muscles. (a) Myosin heavy chain (MYH) (red) and ATG7 (green) immunostaining of abdominal muscle in transverse sections of WT and atg7Δ embryos at E14.5 (scale bar: 50 µm) and of hind limb muscle at E18.5 (scale bar: 25 µm). DAPI is used as a nuclear stain (blue). (b) Left panel: representative immunoblotting analysis of ATG7 and VCL (vinculin) as a loading control in muscle (gastrocnemius, GC) protein extracts from WT and atg7Δ mice at P21. Right panel: representative immunostaining of MYH (red) and ATG7 (green) in WT and atg7Δ muscle sections at P21. DAPI is used as a nuclear stain (blue) (scale bar: 25 µm). (c) Representative immunoblotting analysis of autophagy-related proteins SQSTM1, MAP1LC3 and GAPDH as a loading control in GC protein extracts. (d) Representative SQSTM1 immunostaining (red) of tibialis anterior (TA) sections. DAPI is used for nuclear staining (blue) (scale bar: 100 μm). (e) Representative immunoblotting analysis of ATG7 and GAPDH as a loading control in other organs.
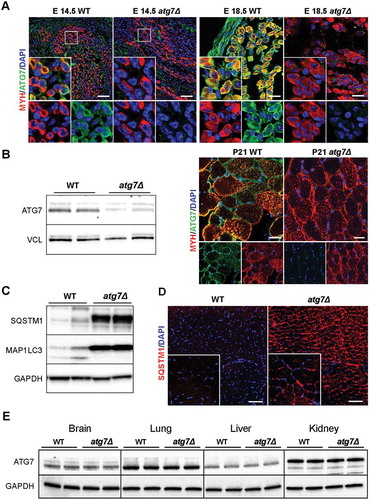
Figure 2. Skeletal muscle growth is severely compromised in atg7Δ mice. (a) Fiber number in TA sections from WT and atg7Δ mice at P21 (n ≥ 4 per genotype). (b) MYH (red) and LAM/laminin (green) immunostaining of hind limb muscle in WT and atg7Δ embryos at E18.5; DAPI is used for nuclear staining (blue) (scale bar: 25 μm). Cross sectional area (CSA) measurement is provided (n = 3 per genotype). (c) Reduced body weight and size in atg7Δ mice compared to the WT counterpart (n ≥ 50 per genotype). (d) Analysis of muscles and organs size in atg7Δ and WT mice at P21 (QD: Quadriceps). Muscles (n ≥ 30 per genotype) and organs (n ≥ 13 per genotype) weights have been normalized to body weight. (e) Growth curve of WT and atg7Δ mice from P7 to P21 (n ≥ 13 per genotype). Values are expressed as mean ± SEM. * vs WT (* P < 0.05, ** P < 0.01, *** P < 0.001).
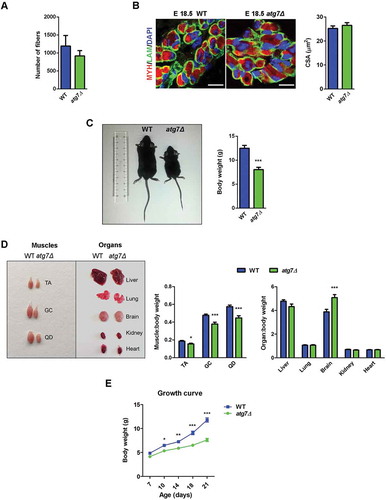
Figure 3. Skeletal muscle growth deficiency in atg7Δ mice during postnatal phase. (a) Weight curve and (b) growth index, calculated as hindlimbs skeletal muscle weight (TA, GC, QD) normalized to body weight, of WT and atg7Δ mice from P7 to P21 (n ≥ 7 per genotype). (c) Representative LAM/laminin immunostaining (red) of TA sections from WT and atg7Δ mice at P21; DAPI is used for nuclear staining (blue) (left panel) (scale bar: 50 μm). Analysis of mean cross sectional area (CSA) (middle panel) and fiber CSA distribution (right panel) (n = 4 per genotype) are provided. (d) Quantitative reverse transcription PCR (RT-qPCR) and immunoblotting analysis of myogenic differentiation markers MYOG and MYOD1 in GC at P21. Densitometric analysis is provided (n ≥ 6 per genotype). (e) Representative MYH immunostaining on TA sections from WT and atg7Δ mice at P21. Percentage of MYH2 (green), and double-positive MYH2 and MYH1 fibers (yellow squares) are provided. LAM/laminin is used for fiber outline (gray); DAPI is used for nuclear staining (blue) (scale bar: 100 µm) (n ≥ 3 per genotype). Values are expressed as mean ± SEM. * vs WT (* P < 0.05, ** P < 0.01, *** P < 0.001).
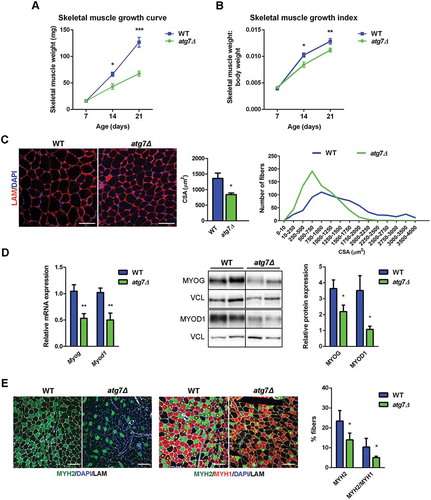
Figure 4. Defective autophagy negatively affects neonatal myogenesis in vivo. (a) RT-qPCR analysis of atrogenes Trim63 and Fbxo32 in GC of WT and atg7Δ mice at P14 and P21 (n ≥ 3 per genotype). (b) Mean number of myonuclei in single fibers from WT and atg7Δ mice at P21 (n ≥ 4 per genotype). (c) PAX7 immunostaining (red). Percentage of PAX7+ cells on total DAPI nuclear counterstaining (blue) is provided. LAM/laminin is used as a fiber outline (green) (scale bar: 20 µm) (n ≥ 3 per genotype). (d) MKI67 immunostaining (red). Percentage of MKI67+ cells on total DAPI nuclear counterstaining (blue) is provided (scale bar: 50 µm) (n = 3 per genotype). (e) RT-qPCR analysis of proliferation-related genes Ccnd1 and Mki67 in GC of WT and atg7Δ mice at P21 (n ≥ 5 per genotype). Values are expressed as mean ± SEM. * vs WT (* P < 0.05, ** P < 0.01, *** P < 0.001).
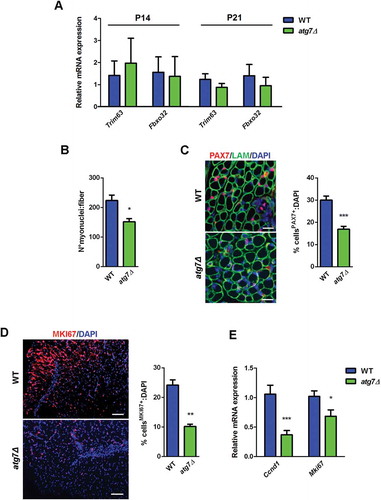
Figure 5. The GH-IGF1 pathway is altered in atg7Δ mice skeletal muscle. (a) RT-qPCR analysis of Ghr and Igf1 and immunoblotting analysis of GHR in GC of WT and atg7Δ mice at P21 (n ≥ 5 per genotype). GAPDH is used as a loading control. (b) RT-qPCR analysis of Ghr and Igf1 in liver of WT and atg7Δ mice at P21 (n ≥ 5 per genotype). (c) Representative immunoblot analysis of phospho-AKT on threonine 308 (p-AKT Thr308) normalized to total AKT (n ≥ 10 per genotype), phospho-RPS6 (p-RPSS6) normalized to total RPS6 (n ≥ 6 per genotype), phospho-EIF4EBP1 (p-EIF4EBP1) normalized to total EIF4EBP1 (n ≥ 8 per genotype), phospho-MAPK1/3 (p-MAPK1/3) normalized to total MAPK1/3 (n ≥ 6 per genotype) in GC protein extracts. Densitometric quantifications are provided. (d) Representative immunoblot analysis of phospho-STAT5 normalized to total STAT5 and RT-qPCR analysis of Ar in GC extracts (n ≥ 5 per genotype). Values are expressed as mean ± SEM. * vs WT (* P < 0.05, ** P < 0.01).
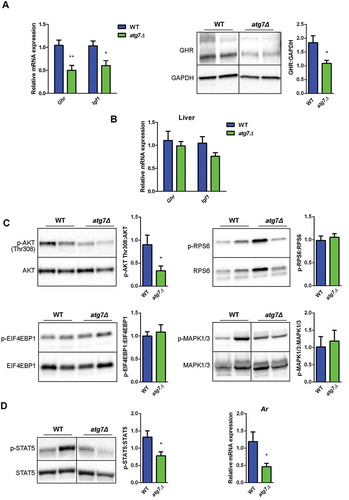
Figure 6. Defective autophagy decreases nSC proliferation and differentiation. (a) Proliferation index of WT and atg7Δ nSCs at 24 (n = 7 per genotype) and 48 h (n ≥ 6 per genotype). (b) Representative immunoblot analysis of the proliferation marker MKI67 in WT and atg7Δ nSC protein extracts. (c-e) Experiments performed with WT and atg7Δ nSCs seeded at low density (25 x 103 cells/0.8 cm2) and differentiated into myotubes after 2 days of proliferation. (c) Representative MYH immunostaining (red) and DAPI nuclear counterstaining (blue) (scale bar: 100 µm) and RT-qPCR analysis of myogenic markers Myog, Myod1 and Myh2 (n ≥ 5 per genotype). (d) Fusion index, calculated as the percentage of the number of nuclei within myotubes over the total number of nuclei, is provided (n = 5 per genotype). (e) Mean myotubes diameter (n = 5 per genotype). (f) Mean number of myonuclei/myotube (n ≥ 5 per genotype) (left panel) and percentage of myotubes with 5 or more nuclei (right panel) (n = 5 per genotype). (g) Experiments performed with WT and atg7Δ nSCs seeded at high density (125 x 103 cells/0.8 cm2) and immediately differentiated into myotubes. Representative MYH immunostaining (red) and DAPI nuclear counterstaining (blue) (scale bar: 100 µm). Fusion index (left panel), mean number of myonuclei/myotube (middle panel) and percentage of myotubes with 5 or more nuclei (right panel) are calculated (n = 3 per genotype). Values are expressed as mean ± SEM. * vs WT (* P < 0.05, ** P < 0.01, *** P < 0.001).
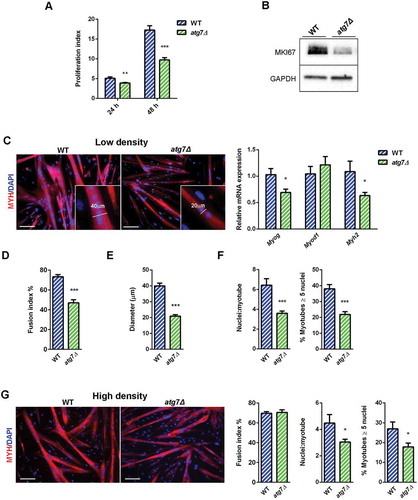
Figure 7. Autophagy is required for GH-IGF1 functions. (a) RT-qPCR analysis of Ghr and Igf1 in WT and atg7Δ nSCs (n ≥ 6 per genotype) and representative immunoblotting analysis of GHR and GADPH, as a loading control, in nSC protein extracts (n ≥ 3 per genotype). * vs WT (* P < 0.05, *** P < 0.001). (b) Myoblasts were switched into differentiation medium (DM) and treated with GH (600 ng/ml) at the beginning (0), after 24 h (24 h) or twice at time 0 and after 24 h (0 h + 24 h) of differentiation and finally harvested at 48 h. Mean number of myonuclei/myotube is calculated. (c) Myoblasts were treated with GH (600 ng/ml) after 24 h of differentiation induction and the mean myotubes diameter is provided. *vs WT untreated control (ctr) nSCs (n = 4 experiments) (* P < 0.05, ** P < 0.01, *** P < 0.001). Values are expressed as mean ± SEM.
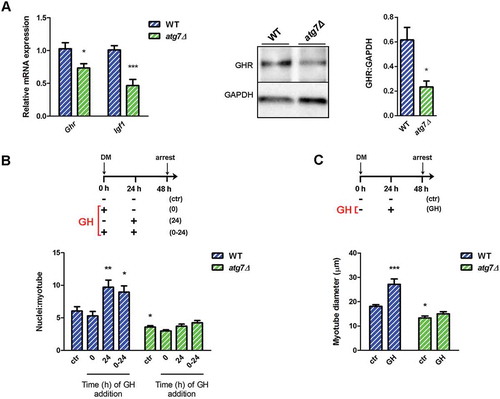
Figure 8. Both NFE2L2 and DDIT3 are dysregulated in atg7Δ muscle and satellite cells. (a) RT-qPCR and immunoblotting analysis of DDIT3 in GC from WT and atg7Δ mice at P21. Densitometric quantification is provided (n ≥ 6 per genotype).*vs WT (* P < 0.05, ** P < 0.01, *** P < 0.001). (b) RT-qPCR analysis (n ≥ 7 per genotype) and representative nuclear immunostaining (red) of DDIT3 in WT and atg7Δ nSCs (scale bar:25 µm). DAPI is used as a nuclear stain (blue). Percentage of DDIT3-positive nuclei is provided (n = 3 per genotype).*vs WT (* P < 0.05, ** P < 0.01). (c) Acute Atg7 deletion mediated by TAT-Cre recombinase: nSCs derived from Atg7 floxed homozygous mice (Atg7fl/fl) and negative for Cre recombinase expression were treated or not with TAT-Cre recombinase for 4 h and cultured in proliferation medium (GM) for 48 h. Representative immunoblot analysis of ATG7, MAP1LC3 and GAPDH, as a loading control, are shown (left panel) and RT-qPCR analysis of Atg7, Ddit3, Ghr and Igf1 are provided (n ≥ 3 experiments) (right panel). * vs untreated Atg7fl/fl (* P < 0.05, ** P < 0.01, *** P < 0.001). (d) Representative immunoblotting analysis of ATG7, SQSTM1, NFE2L2 and GAPDH as loading control in WT and atg7Δ nSCs (n ≥ 4 per genotype) and of (e) SQSTM1, NFE2L2 and GAPDH as a loading control in GC from WT and atg7Δ mice at P21 (n = 7 per genotype). Densitometric quantifications are provided.*vs WT (* P < 0.05, *** P < 0.001). Values are expressed as mean ± SEM.
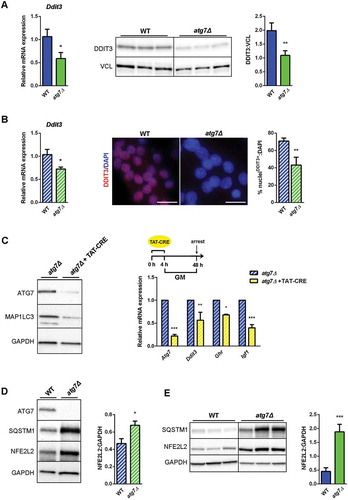
Figure 9. Rescue of ATG7 normalized NFE2L2 and DDIT3 levels and restores GH-IGF1 functions in atg7Δ nSCs. WT and atg7Δ nSCs were infected with control lentivirus (LV ctr) or lentivirus expressing ATG7 (LV Atg7). (a) Representative immunoblot analysis of ATG7, MAP1LC3, SQSTM1 and GAPDH, as a loading control. (b) Representative SQSTM1 immunostaining (red). DAPI is used for nuclear counterstaining (blue); phalloidin (ThermoFisher Scientific, A22287) is used for cell outline (gray) (scale bar: 10 µm). (c) Percentage of MKI67+ cells of total DAPI nuclear counterstaining (n = 3 experiments). (d) Mean number of myonuclei/myotube (left panel) and percentage of myotubes with 5 or more nuclei (right panel) (n = 3 experiments). (e) RT-qPCR analysis of myogenic markers Myog, Myod1 and Myh2 (n ≥ 3 experiments). (f) Representative immunoblotting analysis of ATG7, MAP1LC3, NFE2L2 and GAPDH as a loading control (n = 3 experiments). (g) Representative DDIT3 nuclear immunostaining (red) and DAPI as nuclear counterstaining (blue) (scale bar: 25 µm). (h) RT-qPCR analysis of Ddit3, Ghr and Igf1 (n ≥ 3 per treatment). * vs WT nSCs infected with LV ctr (* P < 0.05, ** P < 0.01, *** P < 0.001); + vs atg7Δ nSCs infected with LV ctr (+ P < 0.05, ++ P < 0.01). Values are expressed as mean ± SEM.
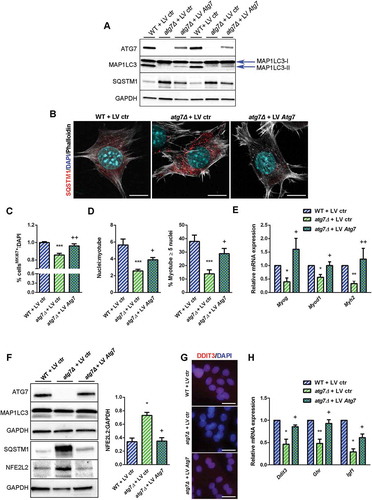
Figure 10. Rescue of DDIT3 and GHR restored myogenic capacity of atg7Δ nSCs. WT and atg7Δ nSCs were infected with control lentivirus (LV ctr) or lentivirus expressing DDIT3 (LV Ddit3) or GHR (LV Ghr). (a) Representative DDIT3 nuclear immunostaining (red) and DAPI nuclear counterstaining (blue) (scale bar: 25 µm). (b) RT-qPCR analysis of Ddit3 after lentivirus infection (n ≥ 4 per treatment). (c) Representative MYH immunostaining (red) and DAPI nuclear counterstaining (blue) (scale bar: 50 µm). Mean number of nuclei/myotube and percentage of myotubes with nuclei number ≥ 5 are provided (n = 3 per treatment). (d) RT-qPCR analysis of Ghr after infection with LV Ddit3 of atg7Δ nSCs (n = 3 per treatment). (e) RT-qPCR analysis of Ghr after infection with LV Ghr of atg7Δ nSCs (n = 3 per treatment). (f) Representative MYH immunostaining (red) and DAPI nuclear counterstaining (blue) (scale bar: 100 µm). Mean number of nuclei/myotube and percentage of myotubes with 5 or more nuclei are provided (n = 3 per treatment). * vs WT nSCs infected with LV ctr (* P < 0.05, *** P < 0.001); + vs atg7Δ nSCs infected with LV ctr (+ P < 0.05, ++ P < 0.01, +++ P < 0.001). Values are expressed as mean ± SEM.
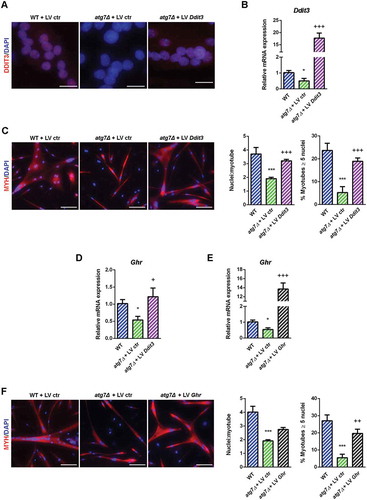
Table 1. Antibodies list.