Figures & data
Figure 1. Reduced GBA protein levels and enzyme activity in GbaL444P/WT hippocampus. (A,B,D) Western blot analysis of GBA protein (A, B) and SNCA(A,D) in WT (n = 3) and GbaL444P/WT (L444P/WT, n = 4) mouse hippocampus; (B) GBA enzyme activity measured in lysosome-enriched fractions of WT (n = 4) and GbaL444P/WT mutant (n = 4) mouse hippocampus. Data are presented as mean percentage (%) of WT controls ± standard error (SE) from 3–4 independent experiments. Compared to WT, **, p < 0.01, Student’s t-test.
Figure 2. Mitochondrial dysfunction in GbaL444P/WT mouse hippocampal neurons (A) Representative micrographs of MitoTracker Red- and MitoTracker Green-labeled WT and GbaL444P/WT primary hippocampal neurons in primary cultures (14–15 DIV). DNA stained with Hoechst 33342 (1 μg/μl, blue) did not show nuclear condensation/fragmentation (left panel). The fluorescence intensities of MitoTracker Red and MitoTracker Green were quantified and the red:green ratio was calculated to estimate normalized MMP (right panel) (n ≥ 40 neuronal soma per condition from 4–5 cultures). Scale bar: 10 μm. (B) Mitochondrial morphology in control and GbaL444P/WT mutant neurons. The aspect ratio (left panel) is a measure of mitochondrial length, which is increased with the GBAL444P mutation. There were no differences in the form factor (right panel), which indicates the degree of mitochondrial branching. (C) Representative micrographs (left panel) and quantification (right panel) of MitoSOX Red-labeled WT and GbaL444P/WT mutant primary hippocampal neuronal cultures. Scale bar: 10 μm. For all measurements, >40 individual neurons were imaged per genotype from 4–5 culture dishes (8–10 neurons per dish). Blue, Hochest 33342 nuclei stain. Data are presented as mean % of WT controls ± SE. Compared to WT, * p < 0.05; **, p < 0.01, Student’s t-test.
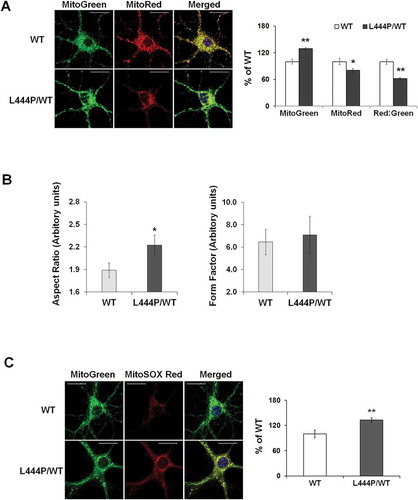
Figure 3. Mitochondrial content and mitochondrial dynamics in GbaL444P/WT mouse hippocampus. (A) Representative western blots of mitochondrial protein and proteins related to mitochondrial fission and fusion in WT (n = 3) and GbaL444P/WT (n = 4) mice. (B) Quantification of western blots normalized to GAPDH levels. Data represent mean % of WT ± SE of 3 experimental replicates. Compared to WT, *, p < 0.05, Student’s t-test.
Figure 4. Impaired mitophagy in GbaL444P/WT mouse hippocampal neurons. (A) Representative micrographs of basal mitophagy in WT:mt-Keima and GbaL444P/WT:mt-Keima primary hippocampal neurons (left panel). Neurons were treated with and without the lysosome protease inhibitors leupeptin and pepstatin A (Leu/Pep, 10 μM each) to determine the amount of mitochondrial degraded by lysosomes. The ratio of the 561:458 nm-excited mito-Keima fluorescence in neuronal cell bodies was calculated to reflect mitophagy activity (right panel) . Scale bar: 10 μm; (n = 40 neurons per genotype from 4–5 culture dishes; 14–15 DIV). (B) MitoGreen and LysoTracker Red colabelling in CCCP-treated WT and GbaL444P/WT primary hippocampal neuronal cultures (left panel, scale bar: 10 μm). Neurons were treated with CCCP (10 µM) for 1 h. The cells were recovered in fresh medium, loaded with MitoTracker Green (MitoGreen; 200 nM) for 30 min followed by LysoTracker Red (LysoRed, 200 nM) for 30 min at 37°C. The number of MitoGreen and LysoRed colabeled puncta (yellow) per cell body were counted as an index of mitophagy (right panel). The boxed areas (scale bar: 2 μm) are shown in higher magnification in the right 3 micrographs for clarity. Individual neurons (40 per condition) from 4–5 culture dishes (8–10 neurons per dish) were analyzed. (C) Mitochondrial levels of autophagy receptor proteins in brain tissue from WT (n = 12) and GbaL444P/WT (n = 12) mice. Brain mitochondria were fractionated and analyzed for mitophagy proteins PINK1 and PARK2, K63- and K48-ubiquitinated species, and the autophagy receptors SQSTM1, NBR1, BNIP3L and OPTN. Protein levels were normalized to VDAC1, as the abundance of VDAC1, when normalized to GAPDH, was consistent with the increase in mitochondrial content in the mutants. Data represent mean ± SE (A, B) or mean % of WT controls (C) from 3 independent experiments. Compared to WT, * p < 0.05; **, p < 0.01, Student’s-t test.
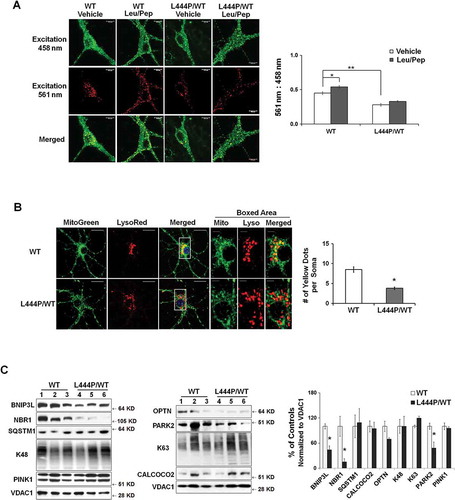
Figure 5. Impaired autophagy-lysosome function in GbaL444P/WT neurons. (A) Western blot analysis of autophagy in WT (n = 3) and GbaL444P/WT (n = 4) mouse hippocampal tissue. (B) Quantification of protein bands normalized to GAPDH showed higher levels of the autophagy proteins LC3B-II and SQSTM1, and lower levels of autophagy regulators p-MTOR, AMBRA1 and BECN1 in GbaL444P/WT compared to WT. Data represent mean ± SE from 3 independent experiments. Compared to WT, * p < 0.05; **, p < 0.01, Student’s-t test. (C) Representative micrographs for LC3B and SQSTM1 immunohistochemistry in the CA1 region of WT (n = 3) and GbaL444P/WT (n = 3) mouse hippocampal sections. Scale bar: 20 μm. (D) Representative hippocampal neurons cultured from CAG-RFP-GFP-LC3B reporter mice crossed with WT or GbaL444P mutant mice (top panels). Quantification of GFP-positive (green) and RFP-positive (red) LC3B puncta in cell bodies of primary hippocampal neurons (DIV 14–15) was used to estimate the amount of reporter LC3B protein degraded by autophagy. Neurons were treated with (PI+) and without the lysosome protease inhibitors leupeptin and pepstatin A (10 μM each) to determine the amount of reporter LC3B degraded by lysosomes. Induced autophagy was assessed by treating neurons with rapamycin (200 µM) + leupeptin and pepstatin A. Green puncta denote GFP-positive autophagosomes prior to fusion with lysosomes, and RFP-positive red puncta denote the total pool of autophagic vacuoles. The ‘Red-Green’ denotes autolysosomes, which was calculated by subtracting the number of GFP-positive from RFP-positive puncta. Data are mean ± SEM of ~40 neurons from 4–5 dishes of living neuronal cultures per condition. Compared to WT, *, p < 0.05; **, p < 0.01, One-way ANOVA, Bonferroni post hoc test. Scale bar: 10 μm.
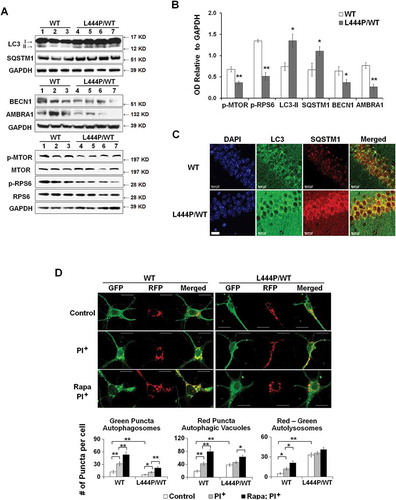
Figure 6. Dual effects of heterozygous GBA mutation on mitophagy. (A) GBA protein levels of GBA knockout (KO), MYC-WT GBA (WT) and MYC-L444P (LP) mutant GBA-overexpressing SH-SY5Y cell lines (left panel). The overexpression of MYC-WT and MYC-GBAL444P, and the deletion of endogenous GBA were validated by western blotting using anti-MYC and anti-GBA antibodies (middle panel), and by measuring GBA enzyme activity from lysosomal-enriched fractions (right panel). Compared to Mock controls (C), **, p < 0.01, One-way ANOVA, Bonferroni post hoc test; (B) MitoTracker Red, MitoTracker Green, and MitoSOX Red labeling in control, KO, WT and L444P SH-SY5Y cells. All 4 cell lines were loaded with MitoTracker Red (MitoRed, 200 µM, 20 min) and MitoTracker Green (MitoGreen, 200 µM, 20 min), or MitoSOX Red (3 μM, 10 min) prior to live cell imaging. Scale bar: 10 μm; (C-D) Quantification of MitoTracker fluorescence intensity in KO- (C) and L444P- (D) SH-SY5Y cells. MitoGreen and MitoRed fluorescence estimates the amount of total mitochondria and functional mitochondria, respectively. The ratio of MitoRed to MitoGreen fluorescence intensity was calculated to estimate the levels of functional mitochondria (n = 60–80 cells per condition from 3 independent experiments). (E) Quantification of MitoSOX Red fluorescence intensity in control, KO, WT and L444P SH-SY5Y cells (n = 60–80 cells per condition from 3 independent experiments). Both L444P and KO cells exhibited an increase in MitoSOX Red intensity, indicative of mitochondrial oxidative stress. (F) Western blot analysis of mitochondrial fraction for autophagy receptors in control, KO, WT and L444P cells. Compared to controls, L444P cells showed lower mitochondrial levels of SQSTM1, NBR1, and BNIP3L. (G) Impaired autophagy in KO and L444P cells. Control, KO, WT and L444P cells were treated with (PI+) and without (PI−) lysosome inhibitors leupeptin and pepstatin A (10 μM each). Flux of autophagy including lysosomal degradation was denoted as ‘PI+-PI−’. (H) Western blot analysis of autophagy-activating proteins AMBRA1 and BECN1 in all 4 cell lines. Data represent mean % of mock controls from 3 independent experiments. Compared to controls, L444P cells showed a reduction in protein levels of BECN1 and AMBRA1. *, p < 0.05; **, p < 0.01, One-way ANOVA, Bonferroni post hoc test.
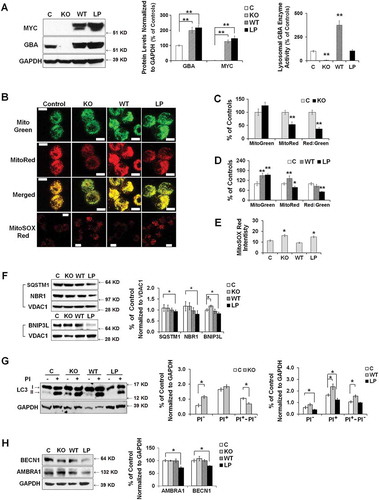
Figure 7. Mitochondrial dysfunction in anterior cingular cortex of control, non-GBA-PD and GBA-PD patients. (A) Western blot (top panel) and quantification of GBA protein levels (bottom left panel) and enzyme activity (bottom right panel). (B) Mitochondrial complex I enzyme activity, measured by dispstick assay. BL, blank. (C) Immunohistochemistry of 8-OHdG. Cortical pyramidal neurons were identified by a characteristic triangular morphology with a prominent apical dendrite pointing toward the pial surface (left panel). Scale bar: 20 μm. Quantification of fluorescence intensity of cytoplasmic 8-OHdG per pyramidal neuron showed an increase in 8-OHdG levels in GBA-PD, indicative of oxidative DNA damage (right panel). (D) Western blot analysis of mitochondrial content. (E) Immunohistochemistry for VDAC1. Upper left, fluorescence micrograph; Upper right, quantification of fluorescence intensity; Lower left, VDAC1+ particles measured by Image J; Lower right, number of puncta quantified using ImageJ. Scale bar, 10 μm. (F) Immunohistochemistry of TOMM20. Upper left, fluorescence micrograph; Upper right, quantification of fluorescence intensity; Lower left, TOMM20+ particles measured by Image J; Lower right, number of puncta quantified using ImageJ. Scale bar, 10 μm. (G) Levels of mitochondrial fusion (OPA1, MFN1, MFN2) and fission (DNM1L, FIS1) proteins. Data represent mean (% of controls) ± SE from 3 independent experiments. Compared to controls, * p < 0.05, **, p < 0.01, One-way ANOVA followed by Bonferroni post hoc test (A, B, D, G) or Student’s t-test (C,E,F).
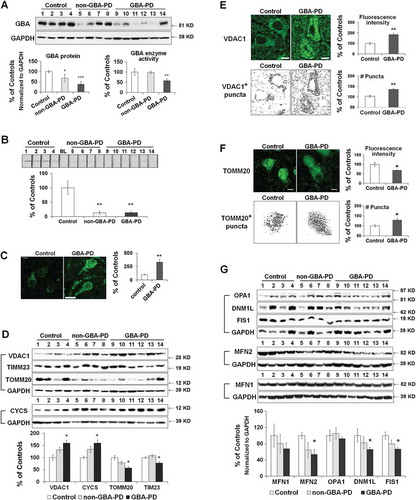
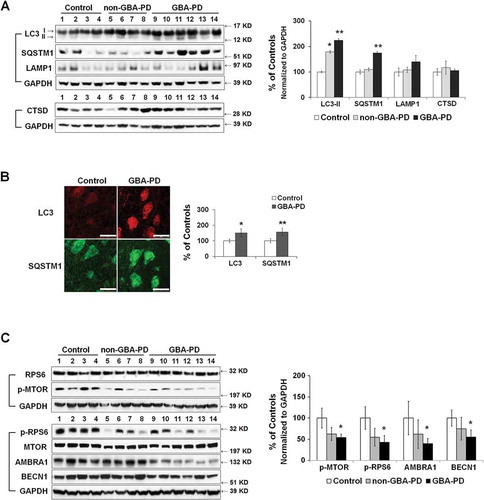
Figure 8. Abnormal autophagy in anterior cingular cortex of GBA-PD patients. (A) Western blot analysis of autophagy and lysosomal proteins in non-GBA-PD and GBA-PD brains (left). Compared to controls, LC3B-II levels were increased in both GBA-PD and non-GBA-PD brains, whereas SQSTM1 protein only accumulated in GBA-PD brain (right). (B) Immunohistochemistry of LC3B and SQSTM1 in control and GBA-PD brains (left). Compared to controls, pyramidal neurons from GBA-PD brains showed increased LC3B and SQSTM1 immunoreactivity (right). Scale bar: 20 μm. (C) Western blot analysis of autophagy regulators MTOR, BECN1 and AMBRA1 in non-GBA-PD and GBA-PD brains (left). GBA-PD brains showed lower protein levels of p-MTOR, p-RPS6, AMBRA1 and BECN1 (right). Data are mean (% of controls) ± SE from 3 independent experiments. Compared to controls, *, p < 0.05; **, p < 0.01, One-way ANOVA followed by Bonferroni post hoc test (A and C) or student’s t test (B).