Figures & data
Figure 1. lgg-1 localizes in puncta inside asc while lgg-2 forms a peripheral discontinuous ring. (a) Schematic representation of phagocytic and apoptotic cells. Pced-8::CED-8::GFP fluorescence labels the plasma membrane of apoptotic cells and Pced-1::CED-1::GFP fluorescence decorates the phagosomal membrane within the phagocytic cell. (b to e) Confocal images of immunofluorescence staining of endogenous lgg-1 (b and d) or lgg-2 (c and e) in embryos expressing an apoptotic membrane GFP (CED-8) or the phagosomal protein CED-1::GFP. White arrows point to puncta present at asc. Insets are 6-fold magnifications of asc. lgg-1 puncta are mainly present inside asc and lgg-2 puncta are generally localized around phagosome. (f and g) Confocal images of live embryos expressing Plgg-1::GFP::lgg-1 (Fi and Fii) or Plgg-2::GFP::lgg-2 (Gi and Gii). Grayscale images are the corresponding DIC acquisitions. Insets (Fiii and Giii) are 3-fold magnifications of lgg-1- or lgg-2-positive asc and correspond to DIC, fluorescent and merge images. The dotted circles on fluorescence images show the outer limit of asc as determined by DIC. In the majority of cases, GFP::lgg-1 localizes in puncta (arrows) inside asc. GFP::lgg-2 is generally detected as a discontinuous ring around asc (53.2%). (h) Confocal images of Plgg-1::mCherry::lgg-1 forming puncta within asc. Pced-1::GFP::lifeact labels the actin-enriched halo formed during engulfment of asc. Insets are 3-fold magnifications. White arrows show puncta present in asc. (i) Quantitative analysis of the localization of GFP::lgg-1, GFP::lgg-2 at AC in control, ced-1(e1735) and ced-1(e1735) ced-5(RNAi) (n > 48) (white, black and gray boxes represent the percentages of dotted, peripheral ring and other patterns, respectively). Chi-squared test analysis *** P value < 0.0001. (j and k) Confocal and DIC images of Plgg-1::GFP::lgg-1 (J) and Plgg-2::GFP::lgg-2 (k) expressed in ced-1(e1735) embryos. Insets show an extruded AC, which outer limit (determined by DIC) is indicated by the dotted circle. Extruded cell corpses do not present GFP::lgg-2 peripheral rings but only internal puncta. (l and m) AC-driven expression using Pegl-1::GFP::lgg-1 (l) and Pegl-1::GFP::lgg-2 (m) shows no peripheral ring. White line shows the outer limit of asc as determined by DIC.
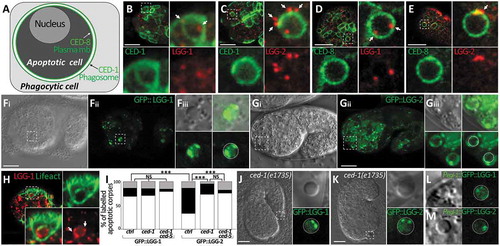
Figure 2. lgg-1 and lgg-2 localization at AC is dependent on canonical autophagy. (a and b) CLEM of GFP::lgg-1 (a) and GFP::lgg-2 (b) at asc. A lgg-1-positive vesicle (red arrow) is present within the AC (dark roundish cell surrounded by white dotted line), while lgg-2-positive vesicles are outside the AC in the phagocytic cell. Scale bars: 1 µm. (c and d) Immuno-EM images of GFP::lgg-1 (c) and GFP::lgg-2 (d) at asc using an anti-GFP antibody. White arrows point to gold beads. Scale bars: 1 µm. (e and f) Confocal images of GFP::lgg-1G116A (e) and GFP::lgg-2G130A expressed in embryos (f). These mutated forms of lgg-1 and lgg-2 are unable to be conjugated. GFP is diffuse in asc and no rings are observed (insets are 3-fold magnifications). (g-l) Confocal images of Plgg-1::GFP::lgg-1 (g, i, k) and Plgg-2::GFP::lgg-2 (h, j, l) in atg-7(RNAi) (g and h), unc-51(e369) (i, j), and bec-1(ok691) (k,l) mutant embryos. Higher magnifications of AC are shown in insets. Both lgg-1 and lgg-2 localization is mainly diffuse and no peripheral ring is visible. Scale bar for E to F: 10 µm.
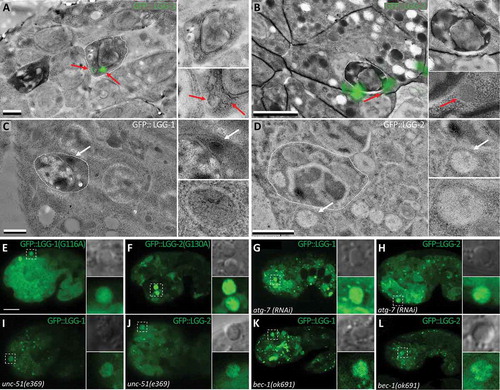
Figure 3. lgg-1 and lgg-2 are involved in the clearance of asc. (a to d) DIC images of the wild type (a), lgg-2(tm5755) (b), lgg-1(tm3489) (c) and lgg-1(tm3489);lgg-2(tm5755) (d) mutant embryos. Arrows indicate cell corpses. Scale bar: 10 µm. (e) Quantification of the mean number of AC visible in comma and 1.5 fold embryos corresponding respectively to 430 and 460 min of development after fertilization. Error bars represent standard deviation (n = 20). Wilcoxon Mann-Whitney test analysis * P value < 0.05, *** P value < 0.0005. (f) Four-dimensional analysis in wild-type, lgg-2(tm5755), lgg-1(tm3489) and lgg-1(tm3489);lgg-2(tm5755) embryos, of the number of cell death events occurring during the 200 min following the appearance of the first AC. The y-axis indicates the cumulative number of cell death events (average of 3 embryos for each genotype). The differences are not statistically significant. (g) The mean duration of 30 cell corpses was calculated for triplicates for each indicated genotype. Student t test analysis ** P value < 0.001, *** P value < 0.0001. (h) The mean number of persistent cell corpses was scored in double mutant embryos for lgg-1 or lgg-2 and membrane recruitment or actin rearrangement mutants and compared with that in single mutants. Error bars represent the standard deviation, n ≥ 15, Wilcoxon-Mann-Whitney test analysis * P value < 0.005, *** P value < 0.0005.
Figure 4. lgg-1 but not lgg-2 is involved in phosphatidylserine exposure on AC. (a to c) Transmission electron microscopy images of cell corpses in embryos and their corresponding schematic representations (aii,bii,cii). aiii, biii, ciii are 3-fold magnifications of the boxed areas showing the membranes surrounding asc (white arrows). Not engulfed asc (a) are easily detected, presenting a dark nucleus, a single surrounding membrane and spaces between neighboring cells. Undegraded-engulfed asc (b) are surrounded by 2 membranes, the cell corpse membrane and the phagosomal membrane. Degraded asc (c) are irregular with a disorganized nucleus and one single surrounding membrane. Scale bar: 0.5 µm. (d) Quantification of the percentages of the 3 categories of asc in the wild-type as well as in the ced-1;ced-5 phagocytosis mutant (n = 45), lst-4;snx-1 lysosomal fusion mutant (n = 29), lgg-1 (n = 27) and lgg-2 (n = 47) mutant embryos. Fisher test analysis of the distribution of the 3 classes * P value < 0.07, ** P value < 0.005, *** P value < 0.0005. (e to h) Epifluorescence images of embryos expressing the GFP reporters of AC phagocytosis CED-1::GFP (e), ACT-5::YFP (f), GFP::2XFYVE (g) and GFP::RAB-7 (h). Arrows indicate cell corpse positive for the reporters and magnified in the insets. Scale bar: 10 µm. (i) Quantification of phagocytosis reporters expression levels in control, lgg-1(RNAi) and lgg-2 mutant embryos. Data represent the ratio between the number of GFP rings and the number of asc visible by DIC. Error bars represent the standard deviation (n ≥ 10). Wilcoxon Mann-Whitney test analysis * P value < 0.05, ** P value < 0.005, *** P value < 0.0005. (j to m) Epifluorescence images of PS fluorescent sensor reporters MFG-e8::mCherry (J,K), ANX::GFP (l) and GFP::Lact (m) in wild-type (j,l,m) and lgg-1(RNAi) (k) embryos. Fluorescent asc indicated by arrows are magnified in insets. (n and o) Quantification of PS fluorescent reporter recruitment in control, lgg-1(RNAi) or lgg-2 mutant (o) embryos. Data represent the ratio between the number of fluorescent rings and the number of asc as determined by DIC. Error bars represent the standard deviation (n ≥ 10). Wilcoxon Mann-Whitney test analysis * P value < 0.05, ** P value < 0.005. (p) Percentage of asc labelled by MFG-e8 with a continuous or discontinuous fluorescent ring in control and lgg-1(RNAi) embryos. n ≥ 30 cell corpses, Fisher test analysis *** P value < 0.0005.
Figure 5. lgg-1 function in AC is not dependent of CED-8. (a and b) Epifluorescence images of CED-8::GFP in control (a) and lgg-1(RNAi) embryos (b). White arrows indicate the ring localization of CED-8::GFP at the plasma membrane of an AC which is magnified in the insets. (c) Quantification of the mean number of asc in control (n = 13) and lgg-1(RNAi) (n = 23) embryos indicates that expressing CED-8::GFP does not affect the number of asc (compare with ). Wilcoxon Mann-Whitney test analysis *** P value < 0.0001. (d) Quantification of CED-8::GFP in control (n = 13) and lgg-1(RNAi) (n = 23) embryos indicates that the depletion of lgg-1 does not affect CED-8::GFP localization. Data represent the ratio between the number of GFP rings and the number of asc visible by DIC, Fisher test analysis. Error bars are standard deviation. (e to g) DIC images of ced-8(n1891) mutants (e), lgg-1(RNAi) (f) and ced-8(n1891);lgg-1(RNAi) (g) embryos. White arrows indicate cell corpses. White arrowheads indicate extruded cells. Scale bar: 10 μm. (h) Quantification of the mean number of asc and extruded cells in WT, lgg-1(RNAi), ced-8(n1891) and double ced-8(n1891);lgg-1(RNAi) 1.5 fold embryos (n = 13, 12 and 20 respectively). Depletion of lgg-1 does not modify the fraction of extruded asc of ced-8(n1891) (Chi-squared test). Error bars are standard deviation. Total number of asc have been analyzed by Wilcoxon Mann-Whitney test * P value < 0.05, *** P value < 0.0001.
Figure 6. lgg-2 is involved in the interaction between phagosomes and lysosomes. (a and b) Time-lapse analysis of Plgg-2::GFP::lgg-2 (a) and Plgg-2::mCherry::lgg-2 (b) distribution around embryonic asc. Green arrows point to GFP::lgg-2 puncta observed first around the AC then disappearing. mCherry::lgg-2 is first observed as puncta that form a discontinuous ring around the AC (red arrows 8 min) and finally as a diffuse signal inside the phagosome (12 to 18 min). Apparition of the diffuse mCherry signal is concomitant with the degradation of the AC as observed by DIC (white arrow). Images are excerpted from Movies 1 and 2. (c) Confocal images of mCherry::VPS-39 expressed in live embryos. Insets are 2.5-fold magnifications of asc in DIC and mCherry fluorescence. White dotted lines in mCherry inset delimit the contours of asc as determined by DIC. Scale bar: 10 µm. (d) Quantification of the mean number of asc in control and vps-39(tm2253) embryos (n = 10 for control and n = 19 for vps-39). Error bars are standard deviation. Wilcoxon Mann-Whitney test analysis (P value * < 0.05). (e to h) Confocal images of asc showing the localization of VPS-39::mCherry (e,f) or NUC-1::mCherry (g,h) and that of either GFP::lgg-2 (e,g) or GFP::lgg-1 (F,H) at the level of the same asc. In the fluorescent images, white dotted lines represent the outer limits of asc as determined by DIC, and yellow arrows point to colocalization. (i) Box-plots of the colocalization between lgg-1 and NUC-1 (n = 67), lgg-2 and NUC-1 (n = 66), lgg-1 and VPS-39 (n = 27), lgg-2 and VPS-39 (n = 42). Overlapping fractions between green and red pixels correspond to Manders coefficients. Welch Two Sample t test analysis (P value *** < 0.001). (j) Time-lapse analysis of a GFP::lgg-2 and LAAT-1::mCherry-positive AC. The formation of a GFP::lgg-2 discontinuous ring is detected first and overlaps with the recruitment of LAAT-1::mCherry (6 min). Images are excerpted from Movie 3. (k) Time-lapse analysis of a LAAT-1::mCherry-positive AC. The AC is first visible in DIC and negative for LAAT-1::mCherry (0 min), then visible in DIC and positive for LAAT-1::mCherry (6 min) and finally the AC disappears in DIC but remains positive for LAAT-1::mCherry (10 min). For each category, top left image is the merge and bottom pictures are split DIC and mCherry. Images are excerpted from Movie 4. Scale bar: 2 µm. (l) Quantification of the 3 categories of AC in control or lgg-2(tm5755) embryos. Chi-squared test analysis (P value * < 0.05).
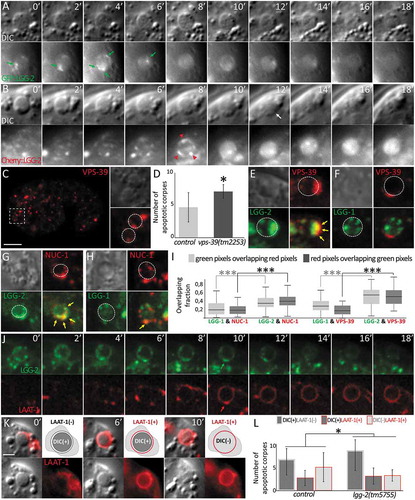
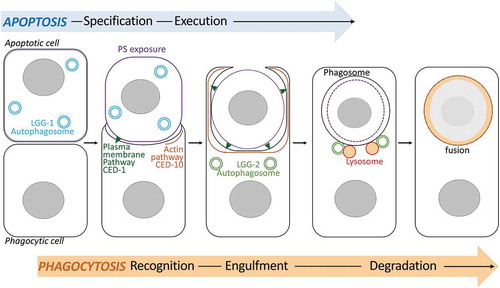
Figure 7. Schematic model of the dual role of autophagy during phagocytosis of apoptotic cells. The model illustrates the involvement of lgg-1 and lgg-2-positive autophagosomes during the phagocytosis of asc in C. elegans embryos. lgg-1 is enriched in the apoptotic cell and is involved in the exposition of PS at the plasma membrane. In the phagocytic cell, lgg-2 autophagosomes are implicated in the fusion between the phagosome and lysosomes to allow efficient AC clearance.