Figures & data
Figure 1. ATG5 participates in BCR clustering and polarization. (a) Representative images obtained for the analysis of BCR localization after various times of stimulation (T = 0; 15; 30; 60 min) with a soluble anti-mouse IgM in control (C57BL/6 and LM) or Atg5-cKO (Cd79a cre) B cells. Images taken with x63 objective on a confocal setup. (b) Quantification of the amount of BCR spots detected after stimulation in control (C57BL/6 and LM) or Atg5-cKO (Cr2 cre and Cd79a cre) B cells, at various time points after BCR engagement. Bars represent mean values per cell ±SEM; ****P < 0.0001 Student t test, N = 100 cells. (c) Representative images obtained for the analysis of BCR localization after various stimulation times with beads conjugated to anti-mouse IgM (T = 15; 30; 60 min) in control (C57BL/6 and LM) or Atg5-cKO (Cd79a cre) B cells. Images were taken with x63 objective on a confocal setup. (d) Polarization index of the BCR after stimulation in control (C57BL/6 and LM) or Atg5-deficient (Cr2 cre and Cd79a cre) B cells with beads conjugated with anti-mouse IgM. This index is the relative angle formed between the center of mass of the cell and the extremes of the staining distribution. Bars represent mean values per individual experiment ±SEM; **P < 0.001, *P < 0.01 Mann-Whitney U test. N = 5, no statistical difference between control mice (C57BL/6 and LM) were revealed. Scale bar: 2 µm.
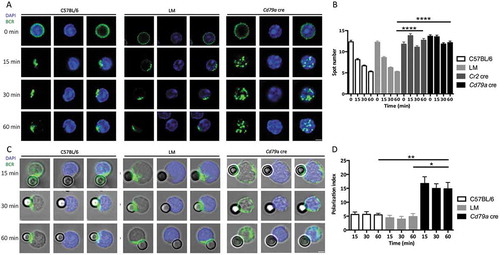
Figure 2. BCR clustering depends on PtdIns3K activity. (a) Immunoblot showing LC3 expression in purified B cells isolated from C57BL/6 mice at steady state or after treatment with the ULK1 inhibitor SBI-0206965, or wortmannin for 3 h. Lysosomal protease inhibitors pepstatin A and E64d were added (+) or not (-) for 4 additional hours in the culture to monitor autophagic flux. ACTB staining was used as a loading control. (b) Histograms representing LC3-II:LC3-I staining intensity ratios in 4 independent experiments performed. Means are shown, and errors bars stand for SEM, **P < 0.01 Mann-Whitney U test, N = 4. (c) Representative images obtained for the analysis of BCR localization before and after 60 min stimulation with a soluble anti-mouse IgM in B cells isolated from C57BL/6 or CD79a cre mice, after treatment with the ULK1 inhibitor SBI-0206965, or wortmannin, for 3 h. Representative images taken with x100 objective are shown. (d) BCR polarization index and spot numbers after stimulation in conditions described in (b). The polarization index is the relative angle formed between the center of mass of the cell and the extremes of the staining distribution (Bars represent mean values per individual experiments ±SEM; ****P < 0.0001, **P < 0.01, *P < 0.05 Student test and Mann-Whitney U test. N = 100 and N = 5 respectively. Scale bar: 2 µm.
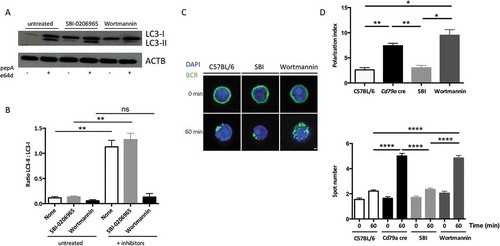
Figure 3. Autophagy-related proteins colocalize with the internalized BCR. (a) Representative images obtained for the analysis of BCR-LC3 colocalization after BCR engagement with a soluble anti-IgM antibody at the indicated times (T = 0; 15; 30; 60 min) in control (C57BL/6 or Littermate) or ATG5-deficient B cells (Cr2 cre and Cd79a cre). Images were taken with x63 objective on a confocal setup. (b) Quantification of BCR and LC3 colocalization in control or ATG5-deficient B cells at indicated time points after BCR engagement (T = 0; 15; 30; 60 min). Colocalization was determined by considering the percentage of cells with a Pearson correlation coefficient comprised between 0.5 and 1, in each independent experiment. Bars represent mean values ±SEM; *P < 0.05 Mann-Whitney U-test, N = 4. (c) Representative images obtained for the analysis of BCR-ATG16L1 colocalization after various times of BCR engagement (T = 0; 15; 30; 60 min) in control (C57BL/6 or LM) or ATG5-deficient (Cr2 cre and Cd79a cre) B cells. Images were taken with x63 objective on a confocal setup. (d) Quantification of BCR-ATG16L1 colocalization in control or in ATG5-deficient B cells after BCR engagement at indicated time points (T = 0; 15; 30; 60 min). Colocalization was determined by considering the percentage of cells presenting a Pearson correlation coefficient comprised between 0.5 and 1, in each independent experiment. Bars represent mean values ±SEM; *P < 0.05 Mann-Whitney U test, (T = 0; 15; 30; 60 min). N = 4, concerning LC3-BCR colocalization, no statistical difference between control mice (C57BL/6 and LM) were revealed. Scale bar: 2 µm.
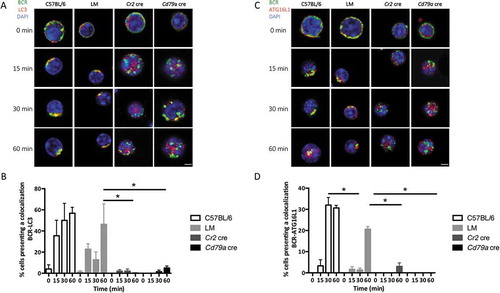
Figure 4. ATG5 participates in the recruitment of LAMP1+ compartments to the immune synapse. (a) Evaluation of lysosomal load in spleen B cells (PTPRC/B220+ and TCRB−) by LysoTracker Deep-Red staining from control (C57BL/6 and LM) and Cd79a cre mice, analyzed by flow cytometry. Representative histograms are shown for each genotype. Summary of mean fluorescence intensities (MFI) obtained on 5 independent mice is shown in histograms. Error bars show SEM. N = 5. (b) Representative images obtained for the analysis of BCR-LAMP1 colocalization after BCR engagement with a soluble anti-IgM antibody at indicated times (T = 0; 15; 30; 60 min) in control (C57BL/6 or Littermate) and ATG5-deficient (Cr2 cre and Cd79a cre) B cells. Images were taken with x63 objective on a confocal setup. (c) Histogram representing quantification of BCR-LAMP1 colocalization in control (C57BL/6) or ATG5-deficient B cells at various time points after BCR engagement with a soluble anti-IgM antibody (T = 15; 30; 60 min). The percentage of colocalization was determined by considering the percentage of cells presenting a Pearson correlation coefficient between 0.5 and 1. Bars represent mean values ±SEM; *P < 0.05 Mann-Whitney U test. N = 3. (d) Representative images obtained for the analysis of BCR-LAMP1 colocalization after various times of BCR engagement by anti-IgM beads (T = 15; 30; 60 min) in B cells from control (C57BL/6, LM) mice or ATG5-deficient B cells (Cd79a cre). Representative cells from 4 independent experiments are shown. Images were taken with x63 objective on a confocal setup. (e) Quantification of BCR-LAMP1 colocalization in control (C57BL/6 and LM) or ATG5-deficient (Cd79a cre) B cells after BCR engagement with a soluble anti-IgM antibody at various time points (T = 15; 30; 60 min). The percentage of colocalization was determined by considering the percentage of cells presenting a Pearson correlation coefficient between 0.5 and 1. Bars represent mean values ±SEM; *P < 0.05 Mann-Whitney U test. N = 4 (C57BL/6), 3 (LM), and 4 (Cd79a cre), no statistical difference between control mice (C57BL/6 and LM) were revealed. Scale bar: 2 µm.
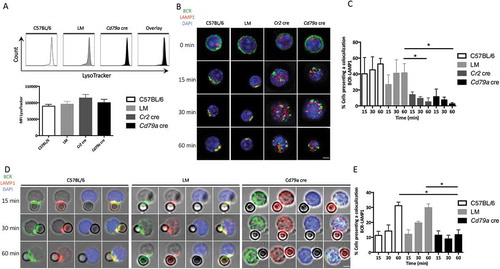
Figure 5. ATG5 is necessary for MHC class II molecule polarization during an interaction with particulate antigens. (a) Representative images for the analysis of BCR-MHC-II colocalization after various time of BCR engagement by soluble anti-IgM antibodies (T = 0; 15; 30; 60 min) in control (C57BL/6 and LM) or ATG5-deficient (Cr2 cre or Cd79a cre) B cells. Images were taken with x63 objective on a confocal setup. (b) Quantification of BCR and MHC-II colocalization in control or ATG5-deficient B cells, at the indicated time points after BCR engagement by a soluble anti-IgM antibody (T = 15; 30; 60 min). Colocalization was determined by considering the percentage of cells presenting a Pearson correlation coefficient between 0.5 and 1. Bars represent mean values ±SEM; *P < 0.05 Mann-Whitney U test. N = 5. (c) Representative images obtained for the analysis of BCR-MHC-II colocalization after BCR engagement by beads conjugated to anti-IgM antibodies, at various times points, (T = 15; 30; 60 min) in control (C57BL/6 and LM) or ATG5-deficient (Cd79a cre) B cells. Images were taken with x63 objective on a confocal setup. N = 4 (d) Quantification of BCR and MHC-II colocalization in control or ATG5-deficient B cells at the indicated time points after BCR engagement with anti-IgM beads (T = 15; 30; 60 min). Colocalization was determined by considering the percentage of cells presenting a Pearson correlation coefficient between 0.5 and 1. Bars represent mean values ± SEM; **P < 0.01 Mann-Whitney U test. N = 4, no statistical difference between control mice (C57BL/6 and LM) were revealed. Scale bar: 2 µm.
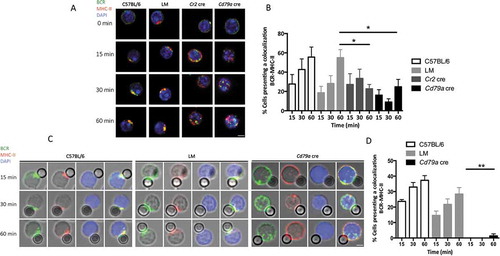
Figure 6. ATG5 is necessary for particulate antigen presentation to T cells. (a) Co/culture with control (C57BL/6 or LM) or Atg5-cKO B cells (Cr2 cre and Cd79a cre) and CFSE-stained OT-II cells were performed. Proliferation was assessed by measuring the dilution of the fluorescent signal by flow cytometry after 3 days of culture. Cells were gated on CFSE+ and TCRB+ cells and CD44 staining was performed to ensure that the decrease of CFSE staining correlated to the activation of OT-II cells. B cells are stimulated either by plate-adsorbed antigen at different concentrations (Fab’2 anti-IgM-OVAL, 10, 5, 2.5 µg/mL; on the left) or by a soluble antigen (F(ab’)2 anti-IgM-OVAL, 10 µg.mL−1; on the right). (b) Percentages of proliferating cells obtained on n = 11 independent experiments (11 C57BL/6, 11 LM, 9 Cr2 cre, 6 Cd79a cre) with different conjugate concentrations (10, 5, 2.5 µg/ml for the adsorbed antigen mimic and 10 µg/mL for the soluble antigen mimic. Bars represent mean values ±SEM; **P < 0.01, *P < 0.05 paired Student t test. (c) Measurement at D15 of anti-OVAL IgM and IgG antibody titers by ELISA, in serum from animals immunized either by soluble OVAL, or OVAL-conjugated with latex beads, in the presence of alum. Each point represents individual anti-OVAL antibody titer. Bars represent the mean ± SEM. *P < 0.05 Mann-Whitney U test, no statistical difference between control mice (C57BL/6 and LM) were revealed. N = 2 to 5.
Figure 7. ATG5 is involved in cytoskeleton mobilization near the immune synapse. (a) Representative images obtained for the analysis of BCR and TUBA1B localization after various times of BCR engagement by anti-IgM beads (T = 15; 30; 60 min) in control (C57BL/6 and LM) or ATG5-deficient (Cd79a cre) B cells. Images taken with x63 objective on a confocal setup. (b) Quantification of centrosome relocalization in control (C57BL/6 and LM) or ATG5-deficient (Cr2 cre and Cd79a cre) B cells, at various time points after BCR engagement (T = 15; 30; 60 min). The distance between the center of mass of the bead and the centrosome was calculated for each cell, for which individual value is plotted. Bars represent mean values ±SEM; ****P < 0.0001, Mann-Whitney U test. N = 5 individual experiments. (c) Representative images for the analysis of BCR and actin corecruitment, at indicated times following BCR engagement by anti-IgM antibody (T = 0; 15; 30; 60 min), in control (C57BL/6 and (LM) or ATG5-deficient (Cd79a cre) B cells. Images were taken with x63 objective on a confocal setup. (d) Quantification of BCR and actin network corecruitment in control (C57BL/6 and LM) or ATG5-deficient (Cr2 cre and Cd79a cre) B cells, at various time points after BCR engagement (T = 15; 30; 60 min). Percentages of cells with Pearson coefficient >0.5 in each independent experiment are plotted. Bars represent mean values ±SEM; **P < 0.01, Mann-Whitney U test no statistical difference between control mice (C57BL/6 and LM) were revealed. N = 5. Scale bar: 2 µm.
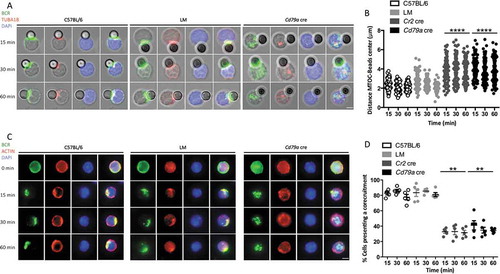
Figure 8. ATG proteins recruit the centrosome-associated protein PCM1, after BCR engagement. ATG16L1 was immunoprecipitated by a label-free method. Partners have been identified by spectrum number counting. The table shows the number of identified spectra for the indicated proteins on the left, in the following conditions: control (CTRL) immunoprecipitation with beads only (IP), IP-ATG16L1, for 3 independent biological and experimental replicates. In each case, non-stimulated (NS) or BCR-stimulated (S) conditions were evaluated. For each experiment, the ratio of spectra numbers between stimulated and non-stimulated conditions is indicated.
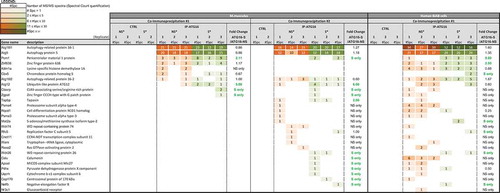
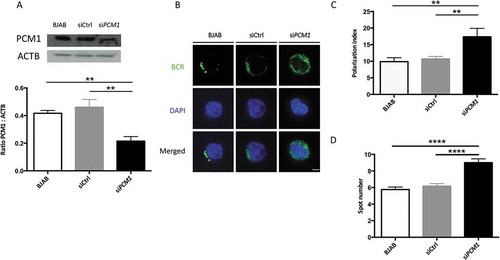
Figure 9. PCM1 is required for B cell polarization after BCR engagement. (a) BJAB cells were transfected with control siRNA, or siRNA targeting PCM1. Transfected and non-transfected BJAB cells were lysed. Top: PCM1 expression was assessed by immunoblot and loading control with ACTB staining was performed. Bottom: PCM1:ACTB intensity ratios were calculated. Means are shown in corresponding histograms, with bars standing for SEM. **P < 0.01 Mann-Whitney U test, N = 4). (b) Representative images obtained for the analysis of BCR localization stimulation by a soluble anti-human IgM at 60 min in non-transfected BJAB cells, or cells transfected with control siRNA (siCtrl) or siRNA directed against PCM1 (siPCM1). Images taken with x100 objective. (c) Polarization index of the BCR staining after stimulation in BJAB cells, or cells transfected with control siRNA (siCtrl) or siRNA directed against PCM1 (siPCM1). This index is the relative angle formed between the center of mass of the cell and the extremes of the staining distribution (Bars represent mean values per individual experiments ±SEM; **P < 0,001, Mann-Whitney U test. N = 4. (d) Quantification of the amount of BCR spots formed after stimulation in BJAB cells, or cells transfected with control siRNA (siCtrl) or siRNA directed against PCM1 (siPCM1). Bars represent mean values per cell ±SEM; ****P < 0.0001 Student test. N = 100 cells. Scale bar: 2 µm.