Figures & data
Figure 9. Illustration of the screening strategy for ATG4B inhibitors and the proposed anti-tumor mechanisms of S130.
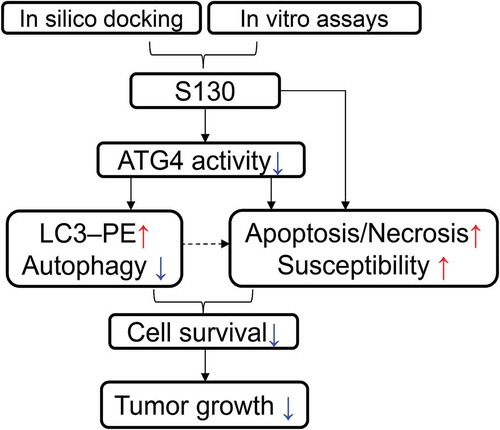
Figure 1. S130 efficiently inhibits ATG4B activity. (A) Structure and IC50 calculation of S130 for ATG4B from fitted curve by FRET assay. (B) Docking mode of S130 at site 5 of ATG4B simulated by Discovery Studio. Yellow dotted lines represent hydrogen bonds between S130 and relevant residues of ATG4B. (C) ATG4B (0.75 μg/ml) was incubated with or without S130 (10 μM) at 37°C for 30 min, FRET-GABARAPL2 was then added and incubated at 37°C for another 30 min. The inhibitory effect of S130 was detected by SDS-PAGE according to the cleavage of FRET substrates. (D) The diagram of the cleavage of LC3 fused with GST by endogenous ATG4B. (E) WT HeLa or ATG4B KO HeLa cells expressing LC3-GST were treated with S130 as indicated for 24 h. The protein level of full-length LC3-GST and cleaved GST were detected by immunoblot. Then the inhibition of ATG4B activity was quantified based on the cleavage of LC3-GST. Data are presented as mean ± SEM from 3 individual experiments.
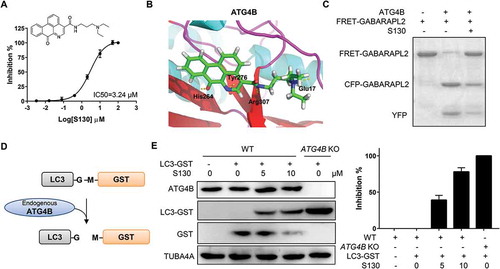
Figure 2. Identification of the specificity and binding affinity of S130 to ATG4B. (A) Surface plasmon resonance measurements were carried out to evaluate the binding affinities of S130 to wild-type or mutant ATG4B. The Kd values of S130 to each protein were calculated based on the fitted curves. (B) Target selectivity of S130 was tested against a panel of cysteine proteases (CASP3, CASP8, CASP9), aspartate proteases (CTSD, CTSE), and serine proteases (F2/thrombin, factor Xa, plasmin, and KLK/kallikrein), respectively. (C) Measurement of the IC50 of S130 for ATG4A from fitted curve by FRET assay. (D) Docking analysis and binding mode of S130 with ATG4A (PDB code: 2P82), yellow dotted lines represent hydrogen bonds between S130 and relevant residues of ATG4A. Data are presented as mean ± SEM from 3 individual experiments. (E) The inhibition type of S130 as an ATG4B inhibitor was determined by using the double reciprocal plot.
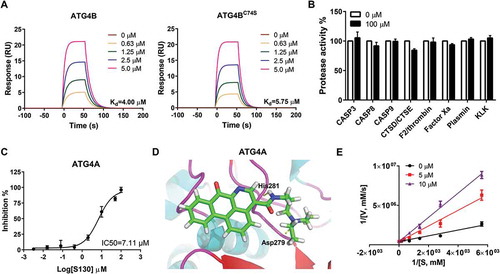
Figure 3. S130 inhibits autophagic flux without affecting the initiation steps of autophagy. (A) HeLa, WT MEFs and atg5 KO MEFs expressing GFP-LC3 were treated with complete medium (CM) or S130 (10 μM) for 6 h. The distribution of GFP-LC3 was examined. (B) HeLa cells treated with 0–20 μM of S130 for 6 h were analyzed by immunoblot. The ratio of LC3-II:TUBA4A was calculated based on the band density. (C) HeLa cells treated with S130 (10 μM) for 6 h in the presence or absence of CQ (40 μM) as indicated were analyzed by immunoblot. The ratio of SQSTM1:TUBA4A and LC3-II:TUBA4A was calculated based on the band density. (D) HeLa cells were treated with S130 (10 μM) or Baf (0.5 μM) for 6 h and the accumulation of SQSTM1 was measured by immunostaining. The number of SQSTM1-positive dots was quantified. (E) HeLa cells were treated with S130 (10 μM) or/and Rap (1 μM) for 6 h, followed by immunostaining of the early stage marker of autophagy, ATG16L1 and ULK1. (F) Immunoblot analysis of WT HeLa or ATG4B KO HeLa cells cultured in CM or starvation medium (EBSS) for 2 h. The bands in ATG4B KO HeLa cells indicate the pro-LC3. The ratio of SQSTM1:TUBA4A was calculated. Data are presented as mean ± SEM from 3 individual experiments. ***P < 0.001, NS, not significant. Arrows indicate ATG16L1- or ULK1-positive structures.
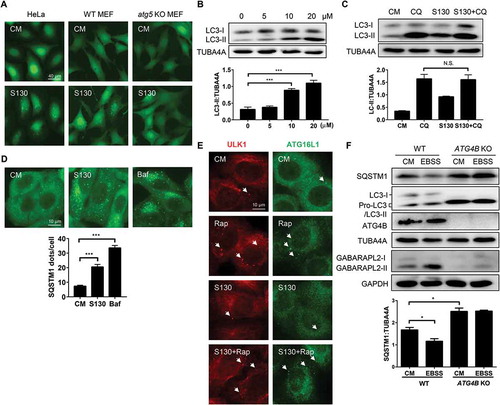
Figure 4. S130 accumulates lipidated LC3 in autolysosomes. (A) HEK293A cells expressing GFP-RFP-LC3 were treated with S130 (10 μM) and Rap (1 μM) for 6 h. The colocalization of GFP and RFP puncta was examined and quantified. (B) HeLa cells were treated with S130 (10 μM) or Baf (0.5 μM) for 4 h, followed by staining with LysoTracker Red (LTR, 50 ng/ml) or acridine orange (AO, 0.5 μg/ml) for 30 min. For the DQ-BSA assay, HeLa cells were pre-incubated with DQ-BSA (10 μg/ml) for 1.5 h and then treated with S130 (10 μM) or Baf (0.5 μM) for 4 h. Fluorescence images of live cells were recorded without fixation. (C) LTR staining of MEF cells expressing GFP-LC3 treated as (B), the colocalization of GFP and LTR was measured and quantified. (D) Representative images of transmission electron microscopy (TEM) depicting ultrastructure of HeLa cells treated with or without S130 (10 μM) for 6 h. Data are presented as mean ± SEM from 3 individual experiments. ***P < 0.001. Green arrows indicate GFP- or LC3-positive structure, yellow arrows indicate the colocalization of GFP and RFP, or LTR (red), red arrows indicate normal autolysosome structures.
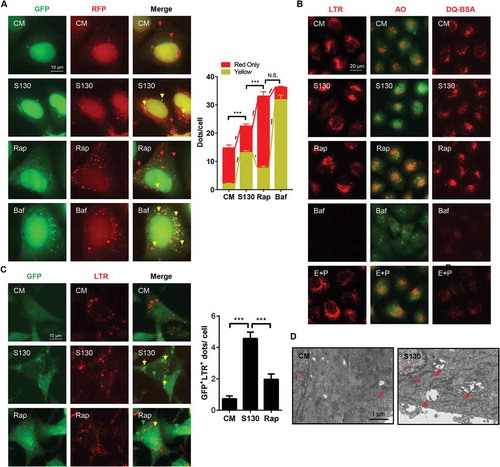
Figure 5. S130 induces cell death through inhibiting the activity of ATG4B. (A) HeLa cells were treated with 0–25 μM of S130 in the presence or absence of 40 μM necrostatin-1, 10 μM of Z-VAD-FMK or 10 μM of CQ for 48 h, and cell viability was measured with CCK8. (B) Cell viability analysis of ATG4B KO HeLa, WT HeLa and ATG4B OE HeLa cells treated with 0–25 μM of S130 for 48 h. (C) Immunoblot analysis of WT HeLa and ATG4B KO HeLa cells treated with S130 (10 μM) for 24 h. (D) Cell viability analysis of ATG4B KO HeLa cells expressing ATG4B, empty vector, ATG4BC74S, or ATG4A treated with 0–25 μM of S130 for 48 h. (E-F) Immunoblot analysis of ATG4B KO HeLa cells overexpressing empty vector or ATG4B with quantification of the protein level of LC3-I and C-CASP3(E), or ATG4BC74S and ATG4A (F) treated with or without S130 (10 μM) for 24 h. The bands in ATG4B KO HeLa cells indicate the pro-LC3. Data are presented as mean ± SEM from 3 individual experiments. *P < 0.05, **P < 0.01, ***P < 0.001.
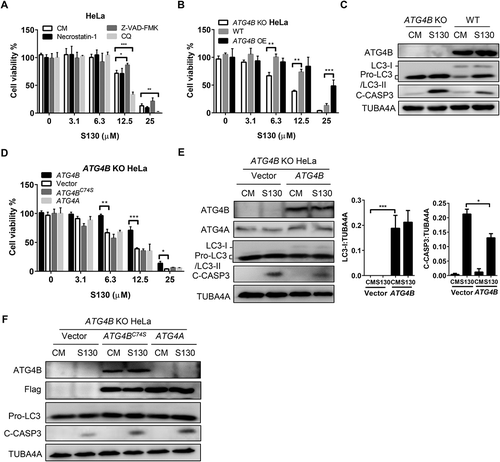
Figure 6. Nutrient starvation sensitizes S130-induced cell death. (A-D) HeLa (A), HCT116 (B), ATG4B OE HeLa (C), and ATG4B KO HeLa (D) cells were treated with 0–25 μM of S130 in CM or EBSS for 48 h, cell viability was measured with CCK8. (E) Immunoblot analysis of HeLa cells cultured in CM or EBSS treated with or without S130 for 3 h. (F) HeLa cells expressing GFP-LC3 were cultured in CM or EBSS treated with or without S130 for 3 h, and the distribution of GFP-LC3 was photographed. Data are presented as mean ± SEM from 3 individual experiments. **P < 0.01, ***P < 0.001.
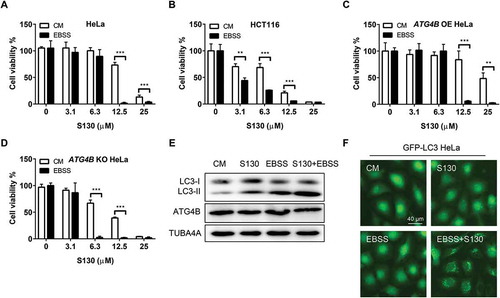
Figure 7. S130 arrests tumor growth of colorectal cancer cells. (A) HeLa cells were treated with the indicated concentrations of S130. Colony formation assay was monitored by crystal violet staining. (B-E) Effects of the indicated treatments (VC, vehicle; S130, 20 mg/kg i.p. daily; CR, caloric restriction with 70% food intake; S130+ CR, combined treatment) on the growth of HCT116 xenografts (n = 6 mice per group). Bodies were weighed after the final injection (B). Tumor volume (C), tumor images (D), and tumor weight (E) were recorded. (F) Tumor tissues were sectioned and subjected to H&E staining for histological morphology evaluation. Scale bar: 50 µm. Data are presented as mean ± SEM. *P < 0.05, **P < 0.01, ***P < 0.001 vs VC.
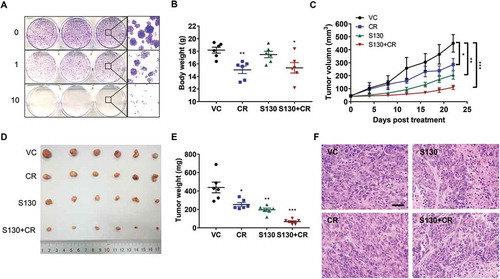
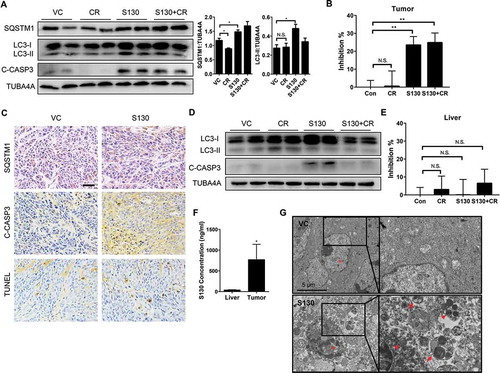
Figure 8. S130 inhibits ATG4B activity of tumor tissue instead of liver tissue. (A) Immunoblot analysis of tumor tissues treated with VC, CR, S130, and S130 plus CR as in . The protein level of SQSTM1 and LC3-II was analyzed. (B) Quantitative analysis of the ATG4 activity of different tumor tissues by FRET assay. (C) Tumor tissues were sectioned and subjected to TUNEL assay and immunohistochemical staining for SQSTM1 and cleaved CASP3. Scale bar: 50 µm. (D) Immunoblot analysis of mice liver tissues from different groups as in (A). (E) Quantitative analysis of the ATG4 activity of different liver tissues by FRET assay. (F) In vivo distribution of total S130 in the liver and tumor tissues from VC and S130 groups as shown in was determined. Data are presented as mean ± SD, *P < 0.05. (G) TEM analysis of the ultrastructure of the representative tumor tissues. Red arrows indicate autolysosomes and red arrowheads indicate mitochondria. Data are presented as mean ± SEM from 3 individual experiments. N.S., not significant, **P < 0.01.