Figures & data
Figure 1. Enrichment of autophagosome markers in autophagosomes isolated from GFP-LC3 mouse tissues. Immunoisolated autophagosome fractions from retina, brain, liver and lung of GFP-LC3 mice were compared with corresponding post-nuclear supernatant fractions of the cell lysates. Note the increase in the amount of autophagosome-related proteins, LC3 (endogenous and GFP-LC3), SQSTM1, and Ser403-phosphorylated-SQSTM1 in the autophagosome fraction (AP) versus the cell lysate. Note that the material for the lysate lanes are taken from the whole cell (post-nucleus removal) without discarding cytosolic LC3, whereas the immunoprecipitation products were from the pellet after removing the cytosolic LC3. As GFP-LC3 is very abundant in the whole cell lysate, the amount of protein loaded into the lysate versus AP lanes are different, so as not to oversaturate the lysate lane. Thus, it appears as if GFP-LC3 is not being enriched. The enrichment of the endogenous LC3, however, helps serve as an internal control for the enrichment. For the immunoblots, 8 µg protein of tissue lysate was loaded. The volume of enriched autophagosome (from a total volume of 50 µL in protocol step 3.3.8) loaded were: 8 µL for retina, 4 µL for brain, 6 µL for liver and 10 µL for lung. Antibodies: LC3A/B (1:1000; Cell Signaling Technology, 4108); SQSTM1 (1:1000; Novus Biologicals, NBP1-48320S); p-SQSTM1 (1:400; Gene Tex, GTX128171).
Figure 2. Fluorescence microscopy of enriched autophagosomes. Enriched autophagosomes from retina, brain, liver and lung were imaged by fluorescence microscopy. Red arrows point to ring-shaped vesicular structures, while the white arrows point to smaller, more punctate structures. Scale bar: 2 µm.
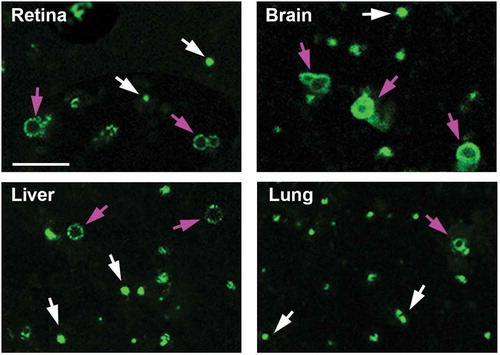
Figure 3. Morphology of autophagosomes isolated from GFP-LC3 mouse tissues. Immunoisolated autophagosomes were stained for TEM analysis. Lower and higher magnification TEM images confirmed double-membrane autophagosomes enriched from retina, brain, liver and lung of GFP-LC3 mice. Arrows in the higher magnification panels point to the double membranes seen on the isolated vesicles. Scale bar: 100 nm.
Figure 4. Increase in autophagosome markers under starvation conditions in immunoisolated autophagosomes. (a) Tissue lysate and immunoisolated autophagosomes from the liver of starved (24 h) and non-starved GFP-LC3 mice were compared by western blotting probed for LC3 and GAPDH. (b) Quantification of the band density, as shown in the histogram, shows the increased levels of autophagosome-related proteins after starvation, consistent with the increased level of autophagy. N = 4 mice; ** P < 0.01.
Figure 5. Intraperitoneal injection of leupeptin as a method to inhibit autophagy flux. (a) Immunoblot and (b) quantification of the levels of GFP-LC3, LC3-I, LC3-II, and GAPDH in the retina, brain, liver and lung of GFP-LC3 mice with a single intraperitoneal injection of leupeptin versus saline (as control). Samples are from the cell lysates and demonstrate the increase in LC3-II relative to LC3-I in the leupeptin sample. Protein levels are normalized to GAPDH levels. * P < 0.05; ** P < 0.01. For the immunoblots, 8 µg of protein was loaded per lane. Antibodies: LC3 (1:1000; Cell Signaling Technology, 4108); GAPDH (1:60,000; Ambion Applied Biosystems, AM4300).