Figures & data
Figure 1. Reduced dendritic arborization and spine density in c9orf72 knockout hippocampal neurons. (a) Schematic of c9orf72 knockout mice showed that exons 2–6 were deleted and resulted in a null allele. (b) Primary hippocampal neurons were cultured from wild-type (C9orf72+/+) and c9orf72 knockout (c9orf72−/-) mice and transfected with a plasmid encoding GFP to visualize the neuronal and dendritic morphology. (c) Images of GFP-transfected hippocampal neurons from control and c9orf72 knockout mice. The images are presented in gray scale and inverted color. Scale bar: 50 µm. (d) High-magnification renderings of dendritic segments. The dendritic images were taken with 0.3-µm step z-section and then stacked as a maximum projection. Scale bar: 10 µm. (e) Sholl analysis of dendritic arborization. (f) Reduced spine density in the c9orf72 knockout neurons. (at least 3 independent experiments, N > 4 neurons per genotype per experiment, 17 total neurons were quantified for E and F, *, p < 0.05; **, p < 0.01; ***, p < 0.001).
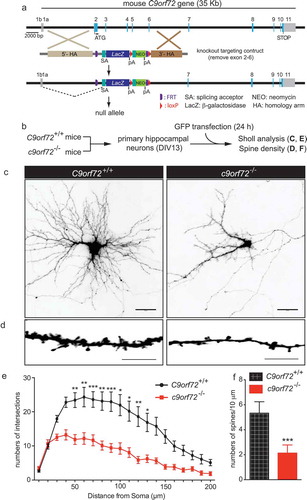
Figure 2. C9orf72 associates with the autophagy initiation complex. (a) Schematic of the LAP-tagged long C9orf72 isoform. (b) Immunoblotting of C9orf72 in an inducible stable cell line expressing a single copy of the long C9orf72 isoform. Lysates from MEFs generated from wild-type and c9orf72 knockout (c9 KO) mice were used to identify the correct immune-reactive band as endogenous C9orf72, as multiple bands were recognized by commercially available C9orf72 antibody. The LAP-tagged C9orf72 long isoform expresses at a comparable level to the endogenous protein. (c) Schematic of SILAC-affinity purification to identify C9orf72-associating proteins. Cell lines stably expressing the LAP-tagged C9orf72 were grown in isotopically ‘heavy’ medium containing 13C6,15N4-arginine and 13C6,15N2-lysine, while the parental line (i.e., no transgene) was grown in ‘light’ medium containing normal arginine and lysine. Elution after the PreScission cleavage step was used for mass spectrometry analysis. (d) Graphic representation of the C9orf72 interactome. Y-axis displays the average ratio of peptides identified in the heavy vs light labeling, while the X-axis represents individual proteins; a protein was considered to be C9orf72-associated if it was at least 8-fold above background signal. The protein ID, median SILAC ratio, and numbers of unique peptides identified are listed. (e) Confirmation of mass spectrometry results by IP-western blots, including RB1CC1, ULK1, ATG13, SMCR8 and WDR41. (f) Reciprocal immunoprecipitation using HA-tagged ATG13 and ATG101. Cells were transfected with plasmids as indicated with pcDNA6 as a control. HA-tagged ATG13 and ATG101 pulled down the LAP-tagged long C9orf72 isoform. (g) Schematic representation of in situ proximity-ligation assay. (h) Representative results for in situ proximity-ligation assay. Phalloidin staining, which labels F-actin, was used to outline the cells. Scale bar: 20 µm. (i) Quantification of in situ PLA results (N = 3, cell numbers >20 per experiment, ***, p < 0.001). C9, C9orf72.
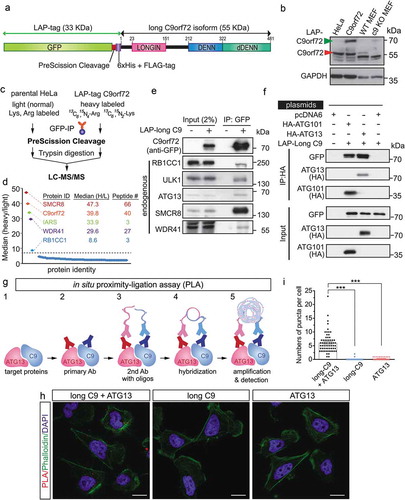
Figure 3. C9orf72 associates with the autophagy initiation complex via isoform-specific DENN-dDENN domains. (a) Yeast two-hybrid (Y2H) mapping of binary interaction pairs. + is used to represent the strength of the X-gal staining and, thus, the strength of the interaction. – means that no cells survived in the 4-drop out conditions. (b) Y2H mapping of C9orf72 domains with SMCR8 and ATG13. Domain representation of long and short C9orf72 isoform, DENN-dDENN, DENN and dDENN domains and their association with SMCR8 and ATG13. (c) GFP immunoprecipitations were performed using the transiently expressed long or short C9orf72 isoform in cells and probed with SMCR8. Long and short C9orf72 isoforms were probed with FLAG antibody. The long, but not the short, C9orf72 isoform co-immunoprecipitated with SMCR8. (d) Proposed interactions among long C9orf72, SMCR8, and the autophagy initiation complex. The carboxyl terminus of the DENN-dDENN domains of C9orf72 is critical for their direct interaction with ATG13 and SMCR8, the latter of which also directly interacts with ULK1 and ATG13. C9, C9orf72.
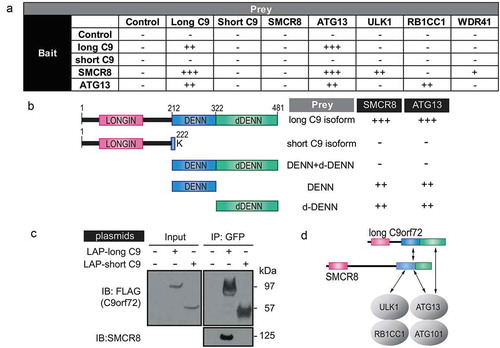
Figure 4. Reduced autophagy in c9orf72 knockout neurons accompanied by reduced ULK1 levels. (a) Immunofluorescence images of endogenous LC3 and MAP2/MAP2A on primary hippocampal neurons cultured from wild-type and c9orf72 knockout mice. Scale bar: 20 μm. (b) Fluorescent images of wild-type and c9orf72 knockout hippocampal neurons transfected with photo-convertible GFP (tdEOS)-tagged LC3. Insets show a scaled-up image of the boxed region. Wild-type neurons showed visible LC3-II puncta. Scale bar: 50 µm. (c) Quantification of LC3-II puncta in wild type and C9orf72 knockout hippocampal neurons (at least 3 independent experiments, N > 4 neurons per genotype per experiment, ***, p < 0.001, ****, p < 0.0001). (d) Immunoblots of ULK1, LC3 and GAPDH on lysates of wild-type (C9orf72+/+) and c9orf72 knockout (c9orf72−/-) cortical neurons. Green and blue arrows indicate LC3-I and LC3-II, respectively. Levels of ULK1 and LC3-II were reduced in c9orf72 knockout neurons. (e) Immunoblots of LC3 and GAPDH on lysates of wild type (C9orf72+/+) and c9orf72 knockout (c9orf72−/-) cortical neurons treated with normal growth medium (NGM) or Earle’s balance salt solution with or without chloroquine (CQ). LC3-II accumulated in the presence of chloroquine, indicating the autophagy flux is normal in the c9orf72 knockout neurons.
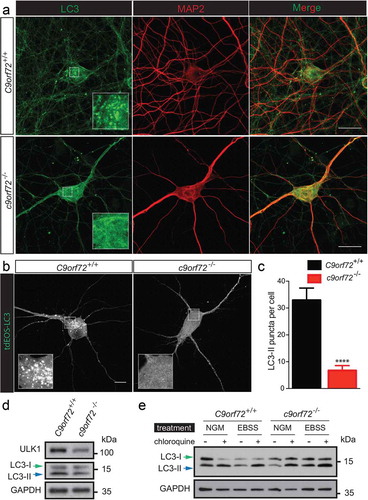
Figure 5. Inhibition of ULK1 kinase activity reduces dendritic arborization and spine density in wild-type hippocampal neurons. (a) Schematic of ULK1 kinase inhibitor (SBI-0206965) treatment in wild-type hippocampal neurons. Wild-type neurons were treated with 1, 2, 5, 10, and 50 μM of SBI-0206965 at DIV7 with a fresh dose every 3 days and transfected with a plasmid encoding GFP at DIV13 to visualize the neuronal morphology. Sholl analysis and spine density was quantified. Ten and 50 µM of SBI-0206965 treatment was toxic to neurons as no neurons survived, and thus, was excluded from the analysis. (b) Images of GFP-transfected hippocampal neurons from control mice treated with DMSO (control), or 1 and 2 µM of SBI-0206965. The images are presented in gray scale and inverted color. Scale bar: 50 μm. (c) High-magnification renderings of dendritic segments. The dendritic images were taken with 0.3-µm step z-section and then stacked as a maximum projection. Scale bar: 5 µm. (d,e) Dose-dependent reduction of dendritic arborization (d) and spine density (e) in the wild-type neurons treated with SBI-0206965 (at least 3 independent experiments were performed, total numbers of neurons scored are indicated, *, p < 0.05; **, p < 0.01; ***, p < 0.001, ****, p < 0.0001). (f,g) Immunoblots of BECN1, phospho-Ser93 BECN1, MTOR, phospho-Ser2448 MTOR, ULK1 and GAPDH in HeLa cells (f) and primary cortical neurons (g) treated with varying concentrations (1, 2, 5, 10, 50 µM) SBI-0206965.
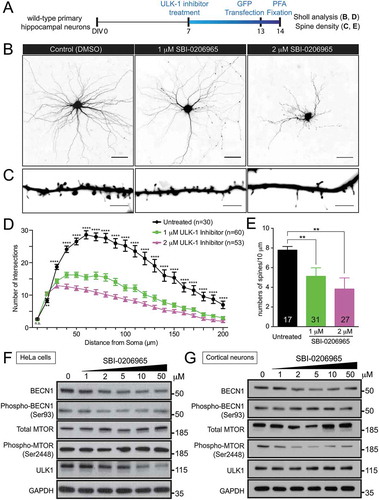
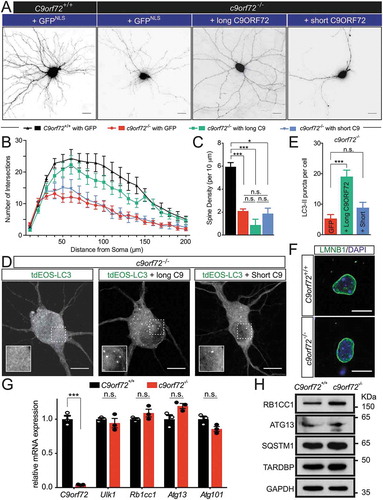
Figure 6. The long, but not the short, isoform of C9orf72, partially rescues the autophagy and the dendritic arborization phenotype. (a) Images of transfected hippocampal neurons from control and c9orf72 knockout mice. Nuclear-localized GFP and membrane-bound mCherry linked by P2A peptide (GFPNLS-P2A-mCherryCAAX, pSYC97), or long or short C9orf72 isoform replacing GFPNLS were examined for their effects on dendritic arborization and autophagy in c9orf72 knockout neurons. Genotypes of neurons are listed in the top panel. The second panels indicate the rescue constructs used: GFPNLS (GFPNLS-P2A-mCherryCAAX, long C9orf72 (long C9ORF72-P2A-mCherryCAAX), and short C9orf72 (short C9ORF72-P2A-mCherryCAAX). The images are presented in gray scale and inverted color. Scale bar: 20 µm. (b,c) Sholl analysis of dendritic arborization (b) and spine density (c) of the rescue experiments (at least 4 independent experiments, N > 3 neurons per genotype per experiment, n.s.: not significant, *, p < 0.05; **, p < 0.01; ***, p < 0.001). (d) Fluorescent images of c9orf72 knockout hippocampal neurons transfected with photo-convertible GFP (tdEOS)-tagged LC3 without or with long C9orf72 (long C9ORF72-P2A-mCherryCAAX) or with short C9orf72 (short C9ORF72-P2A-mCherryCAAX) rescue constructs. Insets show a scaled-up image of the boxed region. Scale bar: 10 µm. (e) Quantification of LC3-II puncta in c9orf72 knockout hippocampal neurons with or without the long C9orf72 rescue construct (at least 3 independent experiments N > 3 neurons per genotype per experiment, ***, p < 0.001). (f) LMNB1-immunofluorescent images of hippocampal neurons from control and c9orf72 knockout mice. Nuclear envelopes were apparently normal in both wild-type and c9orf72 knockout hippocampal neurons. Scale bar: 10 µm. (g) Relative mRNA expression levels of C9orf72, Ulk1, Rb1cc1, Atg13, and Atg101 in primary cortical neurons cultured from wild-type and c9orf72 knockout mice. At least 3 independent cultures were used (n.s.: not significant; ***, p < 0.001). (h) Immunoblots of RB1CC1, ATG13, SQSTM1, TARDBP and GAPDH on protein lysates of primary cortical neurons cultured from wild-type and c9orf72 knockout mice.