Figures & data
Figure 1. POLG CPCs have reduced mitophagy upon induction of differentiation. (a) Representative western blots of LC3-II and ACTA1 in WT and POLG CPCs after incubation in differentiation medium (DM). To assess flux, cells were incubated with 50 nM bafilomycin A1 (Baf) for 4 h before harvesting cells. (b) Quantification of LC3-II:ACTA1 in WT CPCs and POLG CPCs (n = 3). (c) Quantification of LC3-II:ACTA1 ± Baf in WT and POLG CPCs (n = 3). (d) Representative western blots of BECN1 and SQSTM1 in WT and POLG CPCs. Cells were incubated in DM for 7 d. (e) Quantitation of BECN1:ACTA1 and SQSTM1:ACTA1 in WT and POLG CPCs (n = 3). (f) Representative fluorescent images of WT and POLG CPCs overexpressing GFP-LC3. Quantitation of GFP-LC3 and TOMM20 colocalization in WT and POLG CPCs (n = 3). Cells were incubated in DM for the indicated time, fixed, and stained with anti-TOMM20 to label mitochondria. Scale bar: 20 μm. (g) Representative fluorescent images of WT and POLG CPCs overexpressing COX8-EGFP-mCherry at D0 and D3. Quantification of acidic (red-only) mitochondria in WT and POLG CPCs (n = 3). Data are mean ± SEM. *p < 0.05; **p < 0.01; ***p < 0.001; ****p < 0.0001; n.s., not significant.
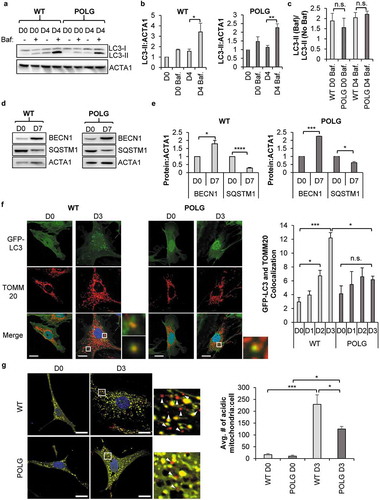
Figure 2. Mitophagy of depolarized mitochondria is functional in POLG CPCs. Cells were infected with β-Gal or mCherry-PRKN prior to treatment with 25 μM FCCP for 24 h. (a) Representative western blots of LC3-II and GAPDH in WT and POLG CPCs. (b) Quantification of LC3-II:GAPDH in WT (n = 4) and POLG CPCs (n = 3). (c) Representative western blots of the mitochondrial protein TIMM23 and GAPDH in WT and POLG CPCs. (d) Quantitation of TIMM23:GAPDH in WT (n = 4) and POLG CPCs (n = 3). Data are mean ± SEM. *p < 0.05; **p < 0.01; ****p < 0.0001.
Figure 3. PRKN is not required for mitophagy in CPCs. (a) Representative western blots of PRKN and GAPDH in mouse CPCs and adult hearts. (b) Real-time PCR analysis of Prkn transcript levels in CPCs and heart tissue (n = 3). (c) Representative western blots of TIMM23 and ACTA1 in WT and prkn−/- CPCs after treatment with 25 μM FCCP for 24 h. (d) Quantification of TIMM23:ACTA1 in WT and prkn−/- CPCs (n = 3). (e) The number and percentage of cells with mRNA detected by single-cell RNA sequencing for Prkn and mitophagy genes in mouse CPCs at passage 0 (fresh) or passage 5 (cultured). Violin plots display gene expression of mitophagy genes in mouse CPCs. (f) The number and percentage of cells with mRNA detected by single-cell RNA sequencing for PRKN and mitophagy receptors in human CPCs at passage 5 (cultured). Violin plots display gene expression of mitophagy genes in human CPCs. Data are mean ± SEM. ***p < 0.001; n.s., not significant.
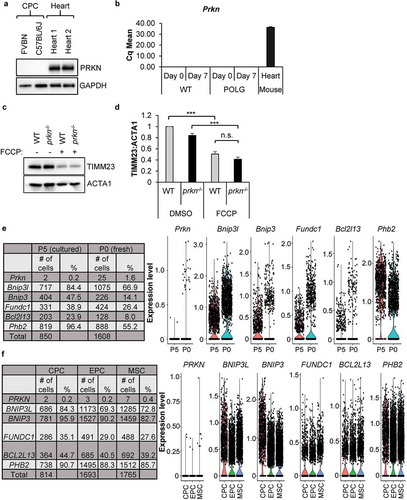
Figure 4. Mitophagy receptors are upregulated in WT CPCs upon differentiation. Real-time PCR analysis of mitophagy receptors (a) Fundc1, (b) Bnip3l and (c) Bnip3 transcript levels in WT and POLG CPCs at baseline and after incubation in DM (n = 4). (d) Representative western blots and quantification of FUNDC1:ACTA1 in WT and POLG CPCs (n = 4). (e) Representative western blots and quantification of BNIP3L:ACTA1 in WT and POLG CPCs (n = 4). Data are mean ± SEM. *p < 0.05; **p < 0.01; ***p < 0.001; n.s., not significant.
Figure 5. Knockdown of Bnip3l and Fundc1 decreases mitophagy in WT CPCs. (a) Representative western blots of BNIP3L and FUNDC1 protein levels after Bnip3l or Fundc1 siRNA co-transfection. FUNDC1 protein increased upon Bnip3l knockdown, while BNIP3L protein increased upon Fundc1 knockdown. (b) Quantification of BNIP3L and FUNDC1 protein levels after siRNA knockdown (n = 3). (c) Real-time PCR analysis of Bnip3l and Fundc1 transcript levels (n = 3). Representative western blots of BNIP3L and FUNDC1 after Bnip3l+Fundc1 knockdown (n = 4). (d) Representative fluorescence images of CPCs overexpressing COX8-EGFP-mCherry. Cells were transfected with siRNA against Bnip3l, Fundc1, or Bnip3l+Fundc1, and incubated in DM for 3 d. Scale bar: 20 μm. (e) Quantification of acidic (red-only) mitochondria in CPCs (n = 3). (f) Representative western blots of TIMM23 after siRNA knockdown of Bnip3l+Fundc1 and treatment with 25 µM FCCP for 24 h. (g) Quantification of TIMM23:ACTA1 in CPCs (n = 3). Data are mean ± SEM; *p < 0.05; **p < 0.01; ***p < 0.001; ****p < 0.0001; n.s., not significant.
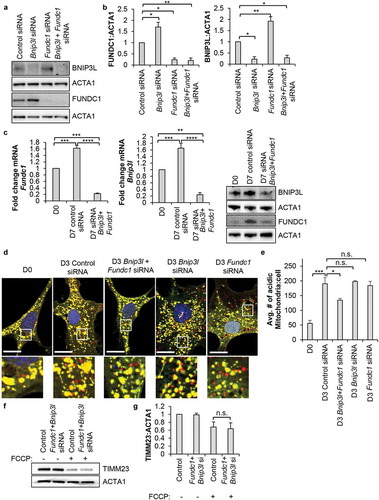
Figure 6. Mitophagy is dispensable for lineage commitment and mitochondrial biogenesis in CPCs. (a) Real-time PCR analysis of Gata4, Gata6, and Mef2c transcripts in CPCs (n = 4). (b) Real-time PCR analysis of Ppargc1a transcript levels in CPCs (n = 4). (c) Representative western blots of mitochondrial OXPHOS subunit proteins ATP5F1A, UQCRC2, MT-CO1, and SDHB in CPCs. (d) Quantitation of mitochondrial OXPHOS subunit protein levels (n = 4). (e) Real-time PCR analysis of secretome-related Ccl2, Il6, and Wnt5a transcripts (n = 3). (f) Representative images and quantitation of endothelial tube formation (complete circles) after incubation in conditioned CPC media for 14 h (n = 3). Data are mean ± SEM. *p < 0.05; **p < 0.01; ***p < 0.001; ****p < 0.0001; n.s., not significant.
Figure 7. Knockdown of mitophagy receptors leads to formation of a fragmented mitochondrial network. (a) Representative fluorescence images of mitochondrial network in CPCs before and after incubation in DM. Scale bar: 20 μm. (b) Quantification of CPCs with fragmented mitochondria (n = 3). (c) Representative electron microscopy images of mitochondria in CPCs before and after incubation in DM. Arrows point to donut-shaped mitochondria. Scale bar: 2 μm. (d) Representative western blots of DNM1L, MFN1 and MFN2. (e) Quantification of DNM1L (n = 5), MFN1 (n = 3) and MFN2 (n = 3) protein levels. (f) Representative western blots of p-DNM1L (Ser 616) and DNM1L. (g) Quantification of p-DNM1L (n = 3) and DNM1L (n = 3) protein levels. Data are mean ± SEM. *p < 0.05; **p < 0.01; ***p < 0.001; n.s. not significant.
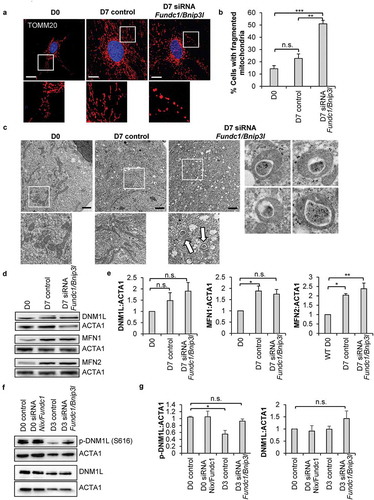
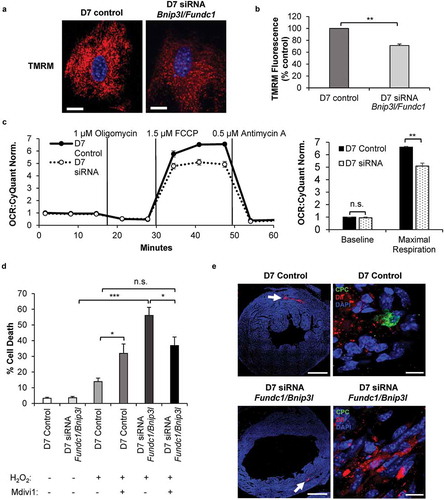
Figure 8. Knockdown of mitophagy receptors leads to reduced mitochondrial function and increased susceptibility to cell death. (a) Representative images of TMRM fluorescence in CPCs. Scale bar: 20 μm. (b) Quantification of TMRM fluorescence (n = 3). (c) Mitochondrial respiration in CPCs at D7. Oxygen consumption rate (OCR) was normalized to cell number (n = 4). (d) Quantification of cell death in differentiating CPCs (D7). Cells were treated with 200 μM H2O2 for 8 h in serum-free DM in the presence or absence of 10 μM Mdivi-1 (n = 3). (e) Representative scans of mouse hearts for retention of GFP-positive CPCs. Hearts from animals injected with either control CPCs or Bnip3l and Fundc1 knockdown CPCs were immunostained with GFP to detect surviving CPCs at 5 d after infarction. Dil dye was utilized to track the injections through the heart. GFP-positive control CPCs were detected in the border zone of infarcted hearts (n = 2), while GFP-positive Bnip3l and Fundc1 knockdown CPCs were not present in the infarcted hearts (n = 5). Scale bar: 1 mm and 10 μm, respectively. Data are mean ± SEM. *p < 0.05; **p < 0.01; ***p < 0.001. n.s., not significant.