
Figures & data
Figure 1. The WX8-family and its effects on osteosarcoma U2OS cells. (a) The WX8-family of small molecules. Shaded regions indicate homologies. WWL and NDF consist of a pyrimidine-4-amine core with 2 morpholine adducts. XB6 and XBA consist of a 1,3,5-triazin-2-amine core with 2 morpholine adducts. WX8 contains the same 1,3,5-triazin-2-amine core with only one morpholine adduct. The remaining components consist of a benzaldehyde hydrazone adduct in NDF and WWL, a simple benzene adduct in XB6 and XBA, and benzene and a purine-like adduct in WX8. (b) Differential interference microscopic images of U2OS cells cultured for 24 h with 1 µM of the indicated compound. Vehicle is the concentration of DMSO that was introduced by addition of compounds. Fewer than 1% of the cells treated with vehicle exhibited a vacuole. (c) The WX8-family of small molecules are listed in PubChem as either a compound or a substance (https://www.ncbi.nlm.nih.gov/pubmed/). Summarized here are their effective concentrations (EC) for inducing vacuoles in U2OS cells within 4 h (Figs. S1-S3), their half maximal effective concentration (EC50) for inducing LC3-II accumulation within 4 to 8 h (Figure S4(a)), their half maximal inhibitory concentration (IC50) for suppressing cell proliferation within 3 d (Figure S4(b)), and their IC50 for reducing cellular ATP levels (viability) within 4 d (Figure S4(c)).
Figure 2. WX8-induced accumulation of enlarged lysosomes. (a) U2OS cells were cultured in the presence of either vehicle or 2 µM WX8 for 2 h before electron microscopy analysis of thin sections of cell pellets. (b) Cells were transfected with baculovirus expressing LAMP1-RFP and then cultured overnight to label lysosomes before addition of either vehicle or 1 µM WX8 for 4 h. Fluorescence emission from fixed cells was visualized by confocal microscopy. Nuclei were stained with DAPI. (c) The diameters of LAMP1-RFP-labeled vacuoles (lysosomes) were measured using ImageJ (https://imagej.nih.gov/ij/) with lysosomes approximated as circles. The selection of circular, enlarged, lysosomes was carried out using a size mask of 0.5 to 5.0 µm2. Punctate lysosomes were selected with a size mask of 0.1 to 1.5 µm2. Thresholds were the same for all images. Clustered lysosomes were not included in the size analysis. The mean area (µm2) ±SEM was plotted (∘). From 235 to 545 lysosomes were measured for each time point. The number of lysosomes per µm2 (□) was determined at the beginning and end of this experiment and plotted on a separate Y-axis. (d) U2OS cells were seeded into 6-well plates (105 cells/well) and cultured overnight before adding 1 µM WX8 and culturing for the times indicated. LAMP1 protein was identified in total cell lysates by western immuno-blotting using ACTB/β-actin as a loading control. (e) The ratios of LAMP1 to ACTB were determined by densitometry for 2 independent experiments (panel E are •,▪).
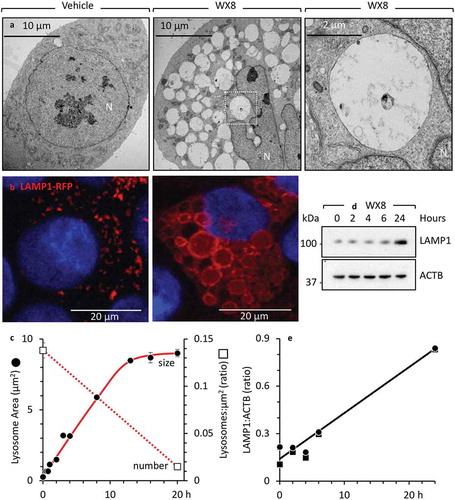
Figure 3. WX8 inhibited lysosomal fission without effecting homotypic lysosomal fusion. (a) U2OS cells expressing LAMP1-RFP were cultured with 1 µM WX8 for 40 min, during which time live cell images were collected. Arrows indicate one example of fusion between 2 lysosomes to produce a larger lysosome. The video is available in Supplemental Materials as Figure S7. (b) U2OS cells were cultured as in panel A, and electron microscopic images of thin sections were taken at 2 h. (c) The section indicated in (B) was enlarged 4X. Arrows indicate sites of lysosome-to-lysosome fusion.
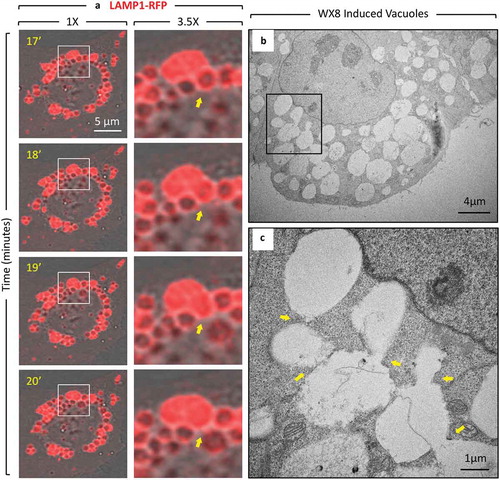
Figure 4. Inhibition of homotypic lysosomal fusion prevented WX8-induced lysosomal enlargement. (a-d) HeLa cells were cultured for 10 min in the presence of either vehicle or 10 μM N-ethylmalaimide (NEM) before washing them with phosphate-buffered saline. Fresh medium was then added containing either vehicle or 1 µM WX8, and the cells were cultured for 1 h. Cells were then stained with anti-LAMP1 antibody, a fluorescent-conjugated secondary antibody to identify lysosomes, and DAPI to identify nuclei, as previously described [Citation22]. Fluorescent images were viewed by confocal microscopy. Scale bar: 5 µm. (e-g) HeLa cells were transfected for 2-days, 2 consecutive times, with a pool of siRNAs against the genes encoding the HOPS-specific subunits VPS39 and VPS41, as previously described [Citation22]. Cells were then incubated for 30 min either with vehicle (V) or with 1 μM WX8 (W). Scale bar: 10 µm. (h) Western immuno-blot with non-targeting (nt) siRNA as a negative control, and GAPDH protein as an internal loading control. (i-l) Wild-type HeLa cells and a derivative HeLa cell line in which the BORCS5 gene was ablated were cultured for 30 min in the presence of either vehicle or 1 µM WX8. Scale bar: 10 µm. Bar graphs indicate the mean ±SD for the lysosomal area in 2 independent experiments for each image.
![Figure 4. Inhibition of homotypic lysosomal fusion prevented WX8-induced lysosomal enlargement. (a-d) HeLa cells were cultured for 10 min in the presence of either vehicle or 10 μM N-ethylmalaimide (NEM) before washing them with phosphate-buffered saline. Fresh medium was then added containing either vehicle or 1 µM WX8, and the cells were cultured for 1 h. Cells were then stained with anti-LAMP1 antibody, a fluorescent-conjugated secondary antibody to identify lysosomes, and DAPI to identify nuclei, as previously described [Citation22]. Fluorescent images were viewed by confocal microscopy. Scale bar: 5 µm. (e-g) HeLa cells were transfected for 2-days, 2 consecutive times, with a pool of siRNAs against the genes encoding the HOPS-specific subunits VPS39 and VPS41, as previously described [Citation22]. Cells were then incubated for 30 min either with vehicle (V) or with 1 μM WX8 (W). Scale bar: 10 µm. (h) Western immuno-blot with non-targeting (nt) siRNA as a negative control, and GAPDH protein as an internal loading control. (i-l) Wild-type HeLa cells and a derivative HeLa cell line in which the BORCS5 gene was ablated were cultured for 30 min in the presence of either vehicle or 1 µM WX8. Scale bar: 10 µm. Bar graphs indicate the mean ±SD for the lysosomal area in 2 independent experiments for each image.](/cms/asset/b7317fc0-a897-4bb2-92c1-827657f2849f/kaup_a_1586257_f0004_c.jpg)
Figure 5. Enlarged lysosomes that formed in the presence of WX8 underwent fission via tubulation when WX8 was removed. (a) U2OS cells expressing LAMP1-RFP were cultured with 0.1 µM WX8 for 2 h. The cells were then washed twice with phosphate-buffered saline before transferring them to fresh culture medium without WX8. Cells were monitored by live-cell imaging for 1 h with one exposure every 3 s (video Figure S6). Images in (b) and (c) start at 13 min and 33:36 min after WX8 removal, respectively, and show magnified time-lapse images of the LAMP1-labeled vesicles present at the times indicated inside the insets and in the whole cells shown in panel A. Arrows facilitate tracking of tubule fate. Scale bar: 20 µm.
Figure 6. WX8 did not impair lysosomal acidity. (a) Mouse RAW 264.7 cells were cultured as previously described [Citation31], and pre-loaded with Oregon Green Dextran in preparation for ratiometric analysis of the pH of individual lysosomes. Cells were cultured for 4 h with vehicle, 1 µM WX8, or 50 mM ammonium chloride, or for 2 h with 0.2 µM apilimod. The results of 2 independent experiments were averaged together. Data were analyzed by one-way ANOVA and Tukey’s post-hoc test. **p < 0.0001. Bars: 10 µm. (b) Human U2OS cells were pre-loaded with Oregon Green Dextran in preparation for ratiometric analysis of the pH of individual lysosomes. The preloaded cells were then cultured as in (a). The results of 3 independent experiments were averaged together. Data were analyzed as in (a). *p = 0.0005, **p < 0.0001. (c) U2OS cells were cultured for 4 h in the presence of either vehicle or 1 µM WX8, and then live cells were stained with LysoTracker Green DND-26 according to the manufacturer’s instructions and viewed immediately by confocal microscopy. (d) U2OS cells were cultured for 4 h with vehicle (V), WX8 or 50 nM bafilomycin A1 (BafA1). Mature and immature CTSD, LC3-I, LC3-II, and ACTB proteins were identified by western immuno-blotting, under the same conditions, and detected with specific antibodies and by cofractionation with molecular mass markers (kDa).
![Figure 6. WX8 did not impair lysosomal acidity. (a) Mouse RAW 264.7 cells were cultured as previously described [Citation31], and pre-loaded with Oregon Green Dextran in preparation for ratiometric analysis of the pH of individual lysosomes. Cells were cultured for 4 h with vehicle, 1 µM WX8, or 50 mM ammonium chloride, or for 2 h with 0.2 µM apilimod. The results of 2 independent experiments were averaged together. Data were analyzed by one-way ANOVA and Tukey’s post-hoc test. **p < 0.0001. Bars: 10 µm. (b) Human U2OS cells were pre-loaded with Oregon Green Dextran in preparation for ratiometric analysis of the pH of individual lysosomes. The preloaded cells were then cultured as in (a). The results of 3 independent experiments were averaged together. Data were analyzed as in (a). *p = 0.0005, **p < 0.0001. (c) U2OS cells were cultured for 4 h in the presence of either vehicle or 1 µM WX8, and then live cells were stained with LysoTracker Green DND-26 according to the manufacturer’s instructions and viewed immediately by confocal microscopy. (d) U2OS cells were cultured for 4 h with vehicle (V), WX8 or 50 nM bafilomycin A1 (BafA1). Mature and immature CTSD, LC3-I, LC3-II, and ACTB proteins were identified by western immuno-blotting, under the same conditions, and detected with specific antibodies and by cofractionation with molecular mass markers (kDa).](/cms/asset/451bdeed-5bf8-45c6-b802-0d4ce4aad6d3/kaup_a_1586257_f0006_c.jpg)
Figure 7. WX8 impaired lysosomal trafficking. U2OS cells were cultured for 4 h in the presence of either vehicle, 1 µM WX8 or 50 nM bafilomycin A1 (BafA1), and then live cells were stained as indicated according to the manufacturer’s instructions and viewed immediately by confocal microscopy. (a) Cells were stained with acridine orange by seeding them into chambered tissue culture slides, adding either vehicle or WX8 the following day and then culturing for 4 h before medium was removed, cells washed once with PBS, then covered with 1 mg/ml acridine orange in PBS and imaged by confocal microscopy at 40X. (b) Cells that had been transfected with LAMP1-RFP expression vector were then stained with LysoSensor Green DND-189 according to the manufacturer’s instructions. (c) Cells that had been transfected with LAMP1-RFP expression vector were then stained with BODIPY-FL-Pepstatin-A, and then fixed 15 min later, according to the manufacturer’s instructions. Nuclei were stained with DAPI, and cells were visualized by confocal microscopy. Bars: 20 µm.
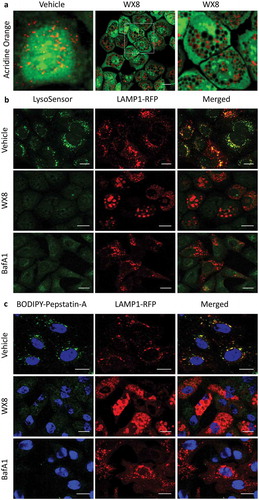
Figure 8. The WX8-family induced accumulation of autophagosome biomarkers. (a) U2OS cells were seeded in 6-well plates (0.7 x 10⁵/well) and 24 h later added the indicated compound to give the indicated concentration (0 µM WX8 received vehicle alone). Cells were cultured for 4 h before total cell extracts were subjected to western immuno-blotting for LC3, SQSTM1 and ACTB/β-actin. Blot was developed with film. (ai) The ratios of LC3-II:ACTB and SQSTM1:ACTB in panel A for cells treated with vehicle alone (0 µM WX8) were subtracted from same ratios in samples treated with WX8. The results were normalized to the maximum ratio. Ratio in cells treated with vehicle (0 µM WX8) was plotted as 0.001 µM WX8 in order to apply a logarithmic scale. (b) U20S cells were cultured for the times indicated in the presence of 1.2 µM WX8 to produce 80% of the maximum observed in panel A. Total cell extracts were assayed at the times indicated. (bi) The ratios of LC3-II:ACTB and SQSTM1:ACTB in panel B were plotted as in panel Ai. (c) Western immuno-blots of LC3 protein present in total cell extracts at 4 h and at 8 h of culture in the presence of the indicated WX8-family member. The ratios of LC3-II:ACTB were plotted (Figure S4(a)). The 4 h samples were developed using the Azure c600 imaging system. The 8-h samples were developed with film. All blots were stained with Ponceau S to visualize the ACTB loading control.
Figure 9. WX8-induced accumulation of autophagosomes. (a) U2OS cells were cultured in the presence of either vehicle or 1 µM WX8 for 4 h, and then endogenous autophagosomes were identified by staining cells with fluorescent tagged anti-LC3 antibody. (b) U2OS cells were transfected with a baculovirus expressing GFP-LC3 and then culturing them overnight before addition of either vehicle or 1 µM WX8. Fluorescence was analyzed by confocal microscopy 4 h later. (AI, BI) LC3 and GFP-LC3-labeled puncta per cell were quantified in 50 cells from each of 3 independent experiments (mean ±SEM; Student’s t-test, p < 0.0001). Both LC3 and GFP-LC3-labeled puncta increased 6- to 8-fold in the presence of WX8. (c) Autophagosomes containing cargo were identified by co-transfecting U2OS cells with 2 separate baculovirus expression vectors, one for GFP-LC3 and the other for RFP-SQSTM1. Cells were then cultured overnight before addition of either vehicle or 1 µM WX8. Fluorescence was analyzed by confocal microscopy 4 h later. (d) Using the same protocol as in panel C, U2OS cells expressing tandemly labeled RFP-GFP-LC3B protein were treated with either vehicle or 1 µM WX8 for 4 h. (ci, di) The fraction of yellow puncta was quantified in 50 cells from each of 3 independent experiments (mean ±SEM; Student’s t-test, p < 0.0001). The fraction of yellow puncta increased 4-fold in the presence of WX8.
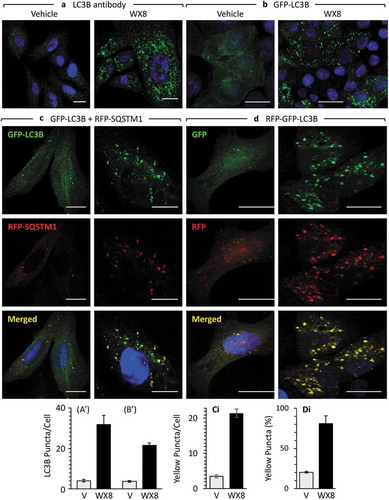
Figure 10. WX8 prevented formation of autolysosomes. U2OS cells were co-transfected with GFP-LC3 and LAMP1-RFP expression vectors. Cells were then treated for 4 h with 1 µM rapamycin to induce autophagy, or with 1 µM WX8 to disrupt autophagy, or with 1 µM rapamycin plus 1 µM WX8. Cells were then fixed and viewed by confocal microscopy. Nuclei were stained with DAPI. The fractions of yellow puncta in merged images of 25 cells is given as the mean ±SEM for 3 independent experiments.
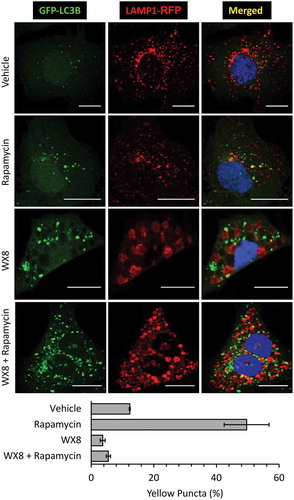
Figure 11. The vacuolar-type H+-ATPase was required for accumulation of enlarged lysosomes. (a) U2OS cells cultured as in to label both LC3 and LAMP1 proteins, and then the cells were cultured in the presence of vehicle, 50 nM bafilomycin A1 (BafA1), 1 µM rapamycin (Rap), 1 µM WX8, or BafA1 plus WX8 for 4 h before viewing with confocal microscopy. (b) Phase contrast images (20X) of cells treated with vehicle, BafA1, WX8, or WX8 plus BafA1 for 4 h. Rap treated cells were indistinguishable from vehicle treated cells. Bars: 20 µm. (c) U2OS cells were cultured for 24 h in the presence of vehicle, 50 nM bafilomycin A1 (BafA1), 1 µM rapamycin (Rap), or Rap plus BafA1, 1 µM WX8, or WX8 plus BafA1. Total cellular LC3 protein was analyzed by western immuno-blotting with ACTB protein as a loading control.
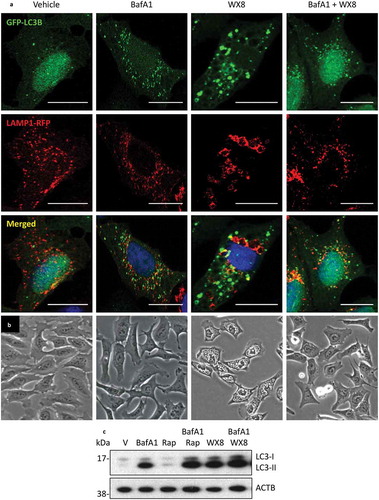
Figure 12. The WX8-family bound specifically to the PIKFYVE phosphoinositide kinase protein. (a) The binding affinity of 10 µM WX8 was profiled against 468 human kinases by DiscoverX KINOMEscan (San Diego, CA). Compounds that bind to the active site of a protein kinase prevented the protein from binding to an immobilized active site ligand, thereby reducing the amount of protein captured on a solid support. Each kinase was tagged with a unique DNA sequence that allowed the amount of protein bound to the solid support to be quantified by PCR. (b) The mean equilibrium dissociation constant (Kd) for WX8 with PIKFYVE, PIP4K2C and MTOR was determined from 2 independent titration curves. A dissociation constant (Kd) was calculated by measuring the amount of kinase captured on the solid support as a function of the test compound concentration (nM) on a log10 scale. (c) Mean Kd values (±range) are given for each WX8-family member. The ratio of PIP4K2C to PIKFYVE indicates relative specificity for these 2 kinases.
Figure 13. The WX8-family mimicked the effects of suppressing PIKFYVE. U2OS cells were cultured overnight, and then transfected for 7 h with 50 pmol siRNA targeted against either PIKFYVE (a) or PIP4K2C (b) mRNA according to the manufacturer’s instructions. Cells were then cultured for 36 h and then total cell extracts were subjected to western immuno-blotting. As a control, cells were also cultured in the presence of 0.1 µM WX8 or 1 µM rapamycin for the same length of time. (c) At end of 36 h, the extent of vacuolization was determined by phase contrast microscopy (40X). (d) To determine whether or not the WX8-family mimicked the MTOR kinase-specific inhibitor rapamycin, U2OS cells were cultured for 24 h in the presence of vehicle (V), or the indicated concentrations of rapamycin (Rap), WX8, NDF, WWL, or XB6. Whole cell extracts were then subjected to western immuno-blotting for LC3, SQSTM1, RPS6 (ribosomal protein S6) and its phosphorylated form (p-RPS6). ACTB was included as a loading control. The positions of molecular mass markers are indicated (kDa).
Figure 14. WX8 selectively killed ‘autophagy-addicted’ melanoma cells. Human melanoma A375 cells were seeded into 12-well plates (1,000 cells/well) and cultured for 1-day before adding WX8, hydroxychloroquine (HCQ), or chloroquine (CQ) to give the concentrations indicated. (a) Cells were photographed 2 d later. (b) Seven days after WX8, HCQ or CQ was added, adherent cells were stained with crystal violet [Citation104]. (c) Cells were seeded into 96-well plates (1,000 cells/well), and WX8, HCQ or CQ was added the following day to give the indicated concentration. Cells were cultured for 4 d before quantifying total cellular ATP using the CellTiter-Glo luminescent cell viability assay (Promega, G7572) according to the manufacturer’s instructions. (d) In separate 12-well plates, attached cells were collected by trypsinization, combined with unattached cells, and stained with trypan blue to identify dead cells. Total live cells in each well were plotted as a percentage of the number of live cells in the vehicle control. Vehicle (0 µM WX8) was plotted as 0.001 µM WX8 in order to apply a logarithmic scale. (e) The half maximal inhibitory concentration (IC50) was the concentration (µM) of WX8, HCQ and CQ that produced a 50% reduction in either cell proliferation (panels B, C) or viability (panel D). All data were plotted as the mean ±SEM for 3 independent experiments. Results for human U2OS (Figure S12), 293T (Figure S13) and HFF (Figure S14) cells are provided as supplementary figures. Assays were performed in duplicate and each experiment was repeated a minimum of 3 times to obtain average EC50 values.
![Figure 14. WX8 selectively killed ‘autophagy-addicted’ melanoma cells. Human melanoma A375 cells were seeded into 12-well plates (1,000 cells/well) and cultured for 1-day before adding WX8, hydroxychloroquine (HCQ), or chloroquine (CQ) to give the concentrations indicated. (a) Cells were photographed 2 d later. (b) Seven days after WX8, HCQ or CQ was added, adherent cells were stained with crystal violet [Citation104]. (c) Cells were seeded into 96-well plates (1,000 cells/well), and WX8, HCQ or CQ was added the following day to give the indicated concentration. Cells were cultured for 4 d before quantifying total cellular ATP using the CellTiter-Glo luminescent cell viability assay (Promega, G7572) according to the manufacturer’s instructions. (d) In separate 12-well plates, attached cells were collected by trypsinization, combined with unattached cells, and stained with trypan blue to identify dead cells. Total live cells in each well were plotted as a percentage of the number of live cells in the vehicle control. Vehicle (0 µM WX8) was plotted as 0.001 µM WX8 in order to apply a logarithmic scale. (e) The half maximal inhibitory concentration (IC50) was the concentration (µM) of WX8, HCQ and CQ that produced a 50% reduction in either cell proliferation (panels B, C) or viability (panel D). All data were plotted as the mean ±SEM for 3 independent experiments. Results for human U2OS (Figure S12), 293T (Figure S13) and HFF (Figure S14) cells are provided as supplementary figures. Assays were performed in duplicate and each experiment was repeated a minimum of 3 times to obtain average EC50 values.](/cms/asset/3e835394-8d8a-457a-8cce-e4c5900376c4/kaup_a_1586257_f0014_b.gif)